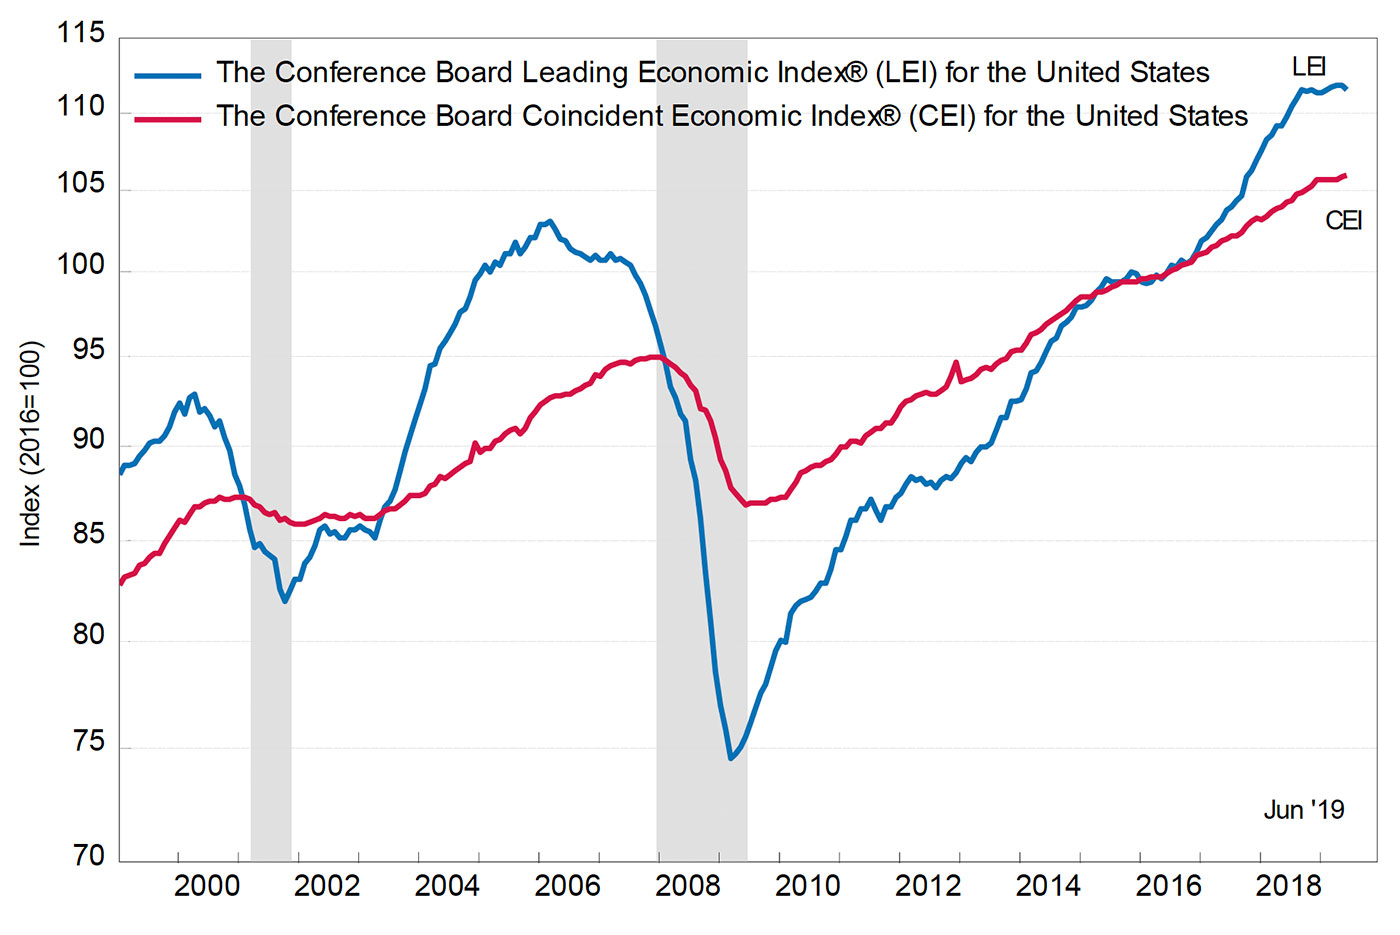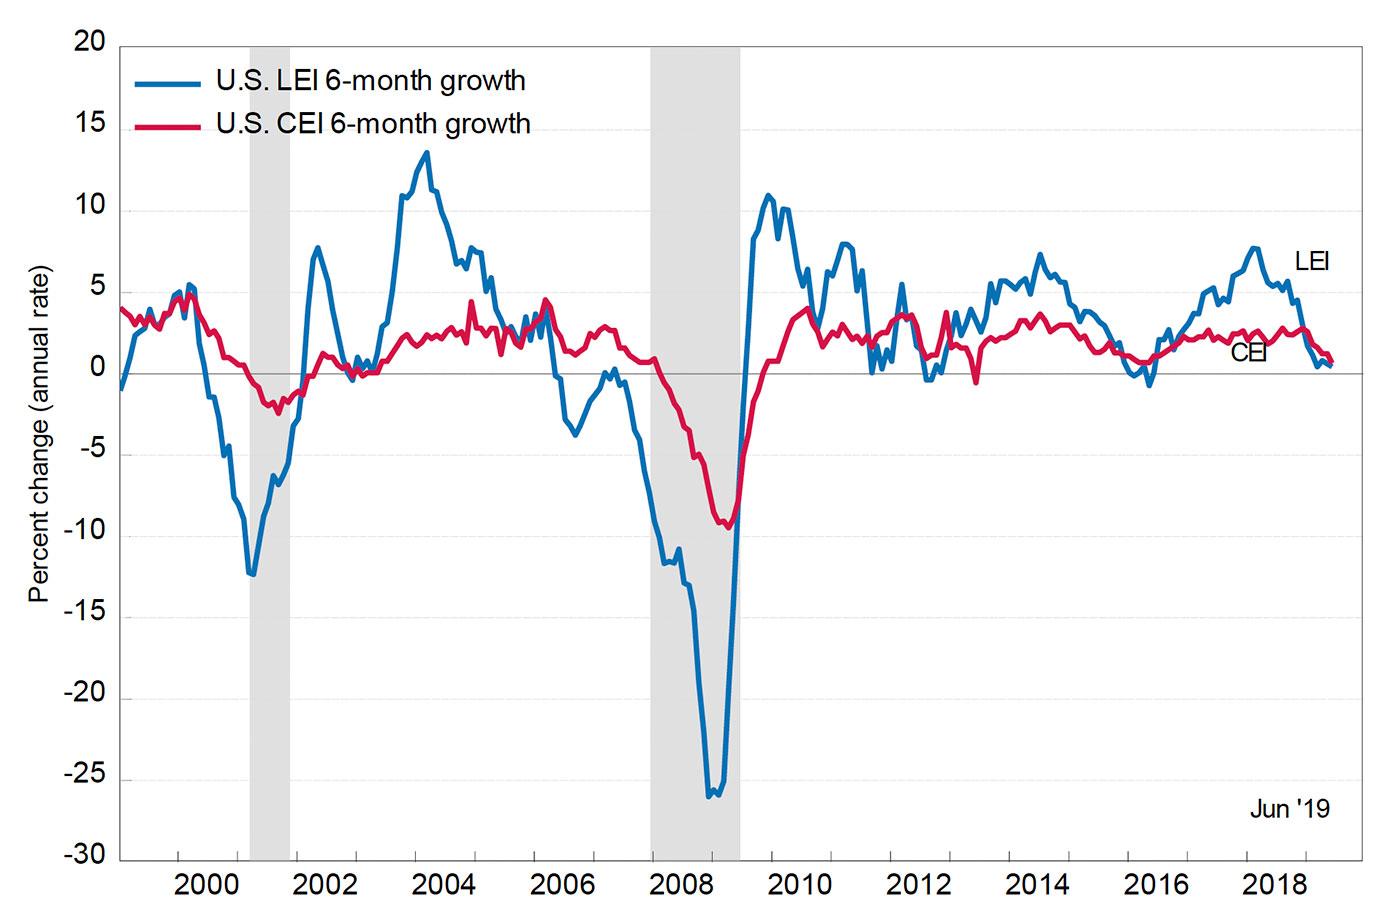
The Conference Board Leading Economic Index (LEI) for the U.S. decreased by 0.3% in June to 111.5, following no change in May and a 0.1% increase in April. This was the biggest decline in three years, according to MarketWatch.
The Conference Board said in its press release on July 18, 2019,

Note: Shaded areas represent recessions.
Source: The Conference Board

Note: Shaded areas represent recessions.
Source: The Conference Board
Despite the dip in the LEI, the report released last week on consumer sentiment by The University of Michigan showed continued strength on consumers’ current and future expectations for economic conditions. This strength was reinforced by last week’s reporting of June retail sales, which handily beat expectations. Barron’s reported that the June report “capped off a roaring second quarter for consumer spending,” which showed an inflation-adjusted 6.1% annualized growth rate in retail sales.

Source: University of Michigan
The University of Michigan’s Surveys of Consumers chief economist, Richard Curtin, wrote in a press release last week,
“Consumer sentiment remained largely unchanged in early July from June, remaining at quite favorable levels since the start of 2017. Moreover, the variations in Sentiment Index have been remarkably small, ranging from 91.2 to 101.4 in the past 30 months. Perhaps the most interesting change in the July survey was in inflation expectations, with the year-ahead rate slightly lower and the longer-term rate moving to the top of the narrow range it has traveled in the past few years. …
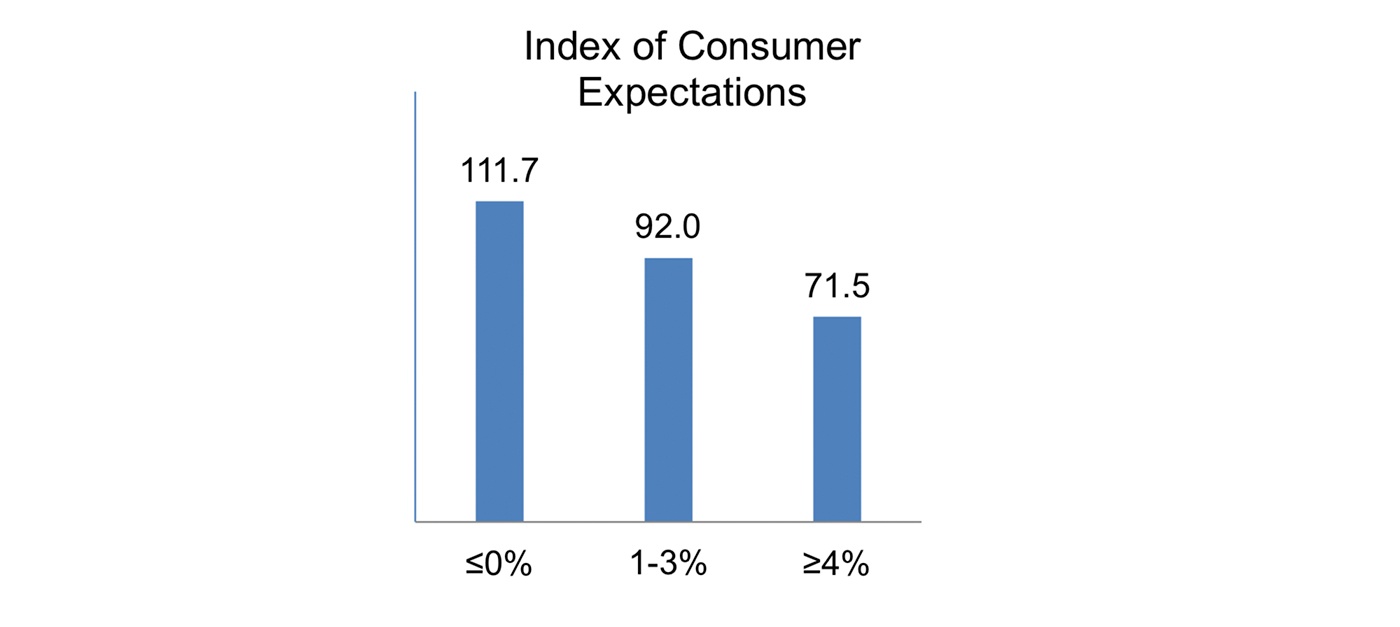
“Given the heightened interest in Fed policy, it is of some interest to examine the relationship between consumers’ inflation expectations and the anticipated strength in the economy as well as prospective shifts in interest rates and unemployment. Inflation expectations were divided into three groups based on responses to the January to July 2019 surveys: those who expected a year-ahead inflation rate less than or equal to 0%, an inflation rate of 1% to 3%, and those who expected an inflation rate equal to or greater than 4% [see Figure 3]. The Consumer Expectations Index falls as inflation expectations rise, signifying that consumers view higher inflation as a threat to economic growth. Higher inflation was related more frequently to rising interest rates and was associated with higher unemployment expectations.”

Note: Consumers grouped by those expecting 0% inflation, 1%–3% inflation, and 4% or more inflation.
Source: University of Michigan
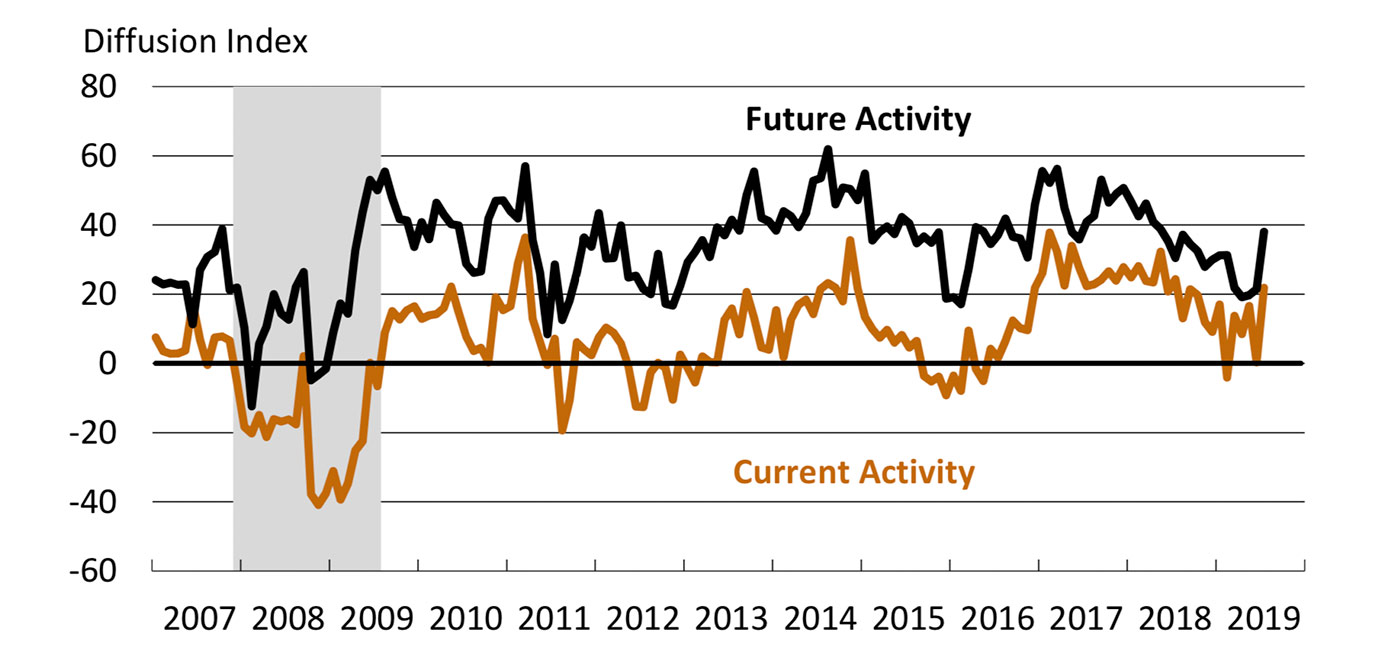
One closely watched economic report released last week showed significant improvement. The outlook for the Philadelphia Fed Manufacturing Business Outlook Survey had a consensus projection of 4.5 for its July index. Instead, it came in at 21.8. Bespoke Investment Group called the data’s improvement versus June “its biggest month-over-month gain since June 2009!”
The Philadelphia Fed press release said, in part,
“The diffusion index for current general activity more than recovered from its decline last month, increasing from 0.3 in June to 21.8 this month. The indexes for current shipments and new orders also improved this month: The current new orders index increased 11 points, while the shipments index increased 8 points.”

Source: The Federal Reserve Bank of Philadelphia
