Of course, some analysts wonder if this is a signal that the market is about to start pulling back on its bullish tendencies (on both the theory that the small investor is “always wrong” and the fact that buying power eventually runs out of steam).
The Journal wrote this past weekend,
“Investors have poured money into stocks through mutual funds and exchange-traded funds in 2017, with global equity funds posting record net inflows in the week ended March 1 based on data going back to 2000, according to fund tracker EPFR Global. … The investors’ positioning suggests burgeoning optimism, with TD Ameritrade clients increasing their net exposure to stocks in February.”
According to TD Ameritrade’s website and a recent press release,
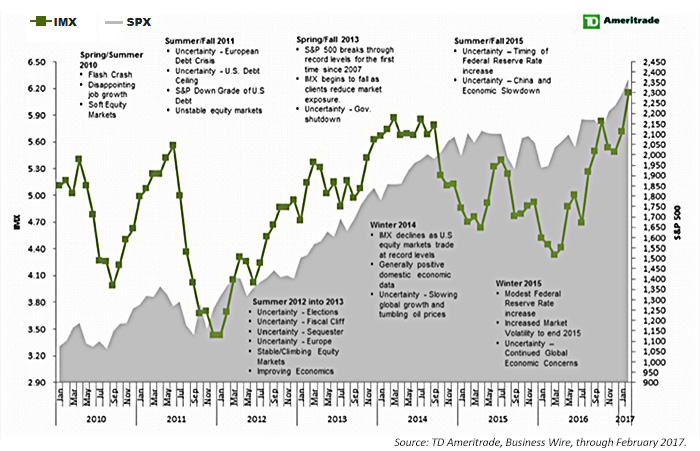
“The IMX (TD Ameritrade Investor Movement Index) rose to 6.15 in February, increasing above 6.0 for the first time ever and reaching an all-time high (Figure 1). … TD Ameritrade clients were net buyers during the February IMX period, increasing exposure to equity markets. Net buying of equities—along with some widely held names seeing their volatility rise relative to the overall market, including Apple, Inc. (AAPL), Facebook, Inc. (FB), and General Electric Company (GE)—helped boost exposure within TD Ameritrade client accounts. The CBOE Volatility Index, or VIX, which measures implied volatility of the S&P 500, dropped below 10 for the first time since 2007 during the period.”

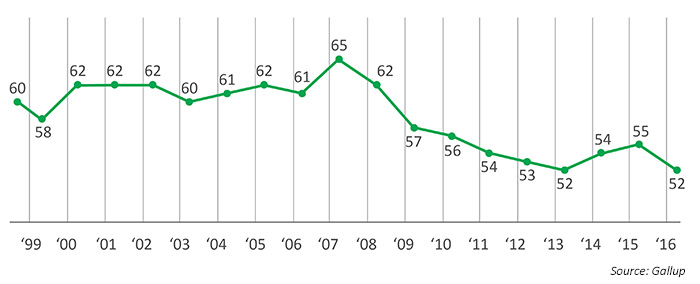
However, most evidence suggests that individual investors remain underinvested in equities compared to periods during the last century and just before the 2008–2009 financial crisis. Money Magazine wrote recently, “Even as this bull market more than tripled the value of stocks over the past eight years, the percent of households that actually own equities has sunk from 62% in 2008 to 52% last year, according to a survey by Gallup. That’s the lowest level of stock ownership in the 19 years that Gallup has been tracking this data.”
Do you, personally, or jointly with a spouse, have any money invested in the stock market right now—either in an individual stock, a stock mutual fund, or in a self-directed 401(k) or IRA?

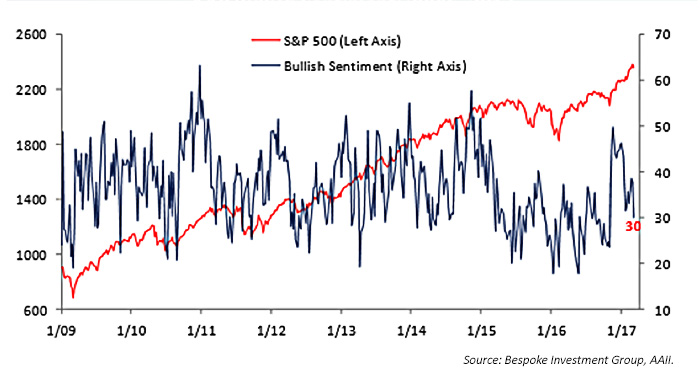
It is also of interest to observe that sentiment among individual investors is far from excessively optimistic. A recent survey of retail investors by the American Association of Individual Investors (AAII) shows that bullish sentiment is well below the highs achieved in the post-financial crisis period (Figure 3).
Bespoke Investment Group said last Friday,
“With Thursday [Feb. 9] marking the anniversary of the financial crisis lows eight years ago, one would think that investors would be in the mood to celebrate. However, in what has been the most hated bull market in history, it seems only fitting that sentiment gauges of individual investors from AAII came in where they did this week. … Bullish sentiment dropped from 37.9% down to 30.0%. That’s the lowest weekly reading in bullish sentiment since the week before the election and also extends the record streak of weeks where bulls haven’t been in the majority to 114!”

