

Long-term cycle charts are interesting to look at, but I’m not sure how much they help one’s trading or strategy. In any case, www.seasonalcharts.com has an interesting 10-year cycle chart of the Dow Jones Industrial Average. The data for the Dow is accumulated by year and then published in a way that shows the pattern of each year of the decade—going back to 1897 in this case.
Stock market years ending in “7” have had some very interesting drama. Many of us remember the Crash of ‘87, of course. Up through August, 1987 had been a wonderful year, as prices surged ahead. There were problems moving forward in September and October, and then a torrent of selling was unleashed beginning on Oct. 14, culminating with the Crash on Oct. 19. The market fell 22% in that one day.

Market historians may also remember the Panic of 1907—which turned out to be very important in the grand scheme of things. In this Panic, the NYSE Index fell almost 50% in a three-week period in October 1907. The NYSE approached J. P. Morgan to round up his friends and provide liquidity to the markets. He had done this before—effectively acting as a Federal Reserve Bank would (but in those days there wasn’t a Fed). He grudgingly did so, and the Panic was contained, but only after some scary moments for Morgan and friends. At that point, he said he wouldn’t be doing this anymore and that the United States needed a Federal Reserve Bank. The Fed was subsequently created in 1913.
1917 wasn’t pretty, either. Despite a booming economy, the Dow lost 33% from November 1916 to November 1917.
1937 was another ugly year, as the Dow lost 22% in the last three months of the year. We’ve written about this time period before. In short, the economy was trying to come out of the Depression, but the Fed raised interest rates too early, sending a secondary shock through the system. The economy plunged, but—not wanting to panic people by using the word “depression” again—the word “recession” was invented. The smoke and mirrors probably didn’t help people too much, though, as the unemployment rate rose to 19%.
In looking at data from the Stock Trader’s Almanac, it is also interesting to note that $SPX lost 14% in 1957 (I don’t remember that one), 11% in 1977 (I do remember that one), and 2007 was pretty scary, too, as that was the year we first learned what “subprime debt” was—and it led to a nasty summer decline.
There were some positive years, most notably 1997 (+31% on $SPX), but mostly they were subdued.
Every 20 years, the year ending in “7” is the first year of the four-year presidential cycle. Those are generally struggling years, as the new regime in power gets all of the “nasty” stuff out of the way early, in hopes that voters won’t remember it three years later.
DOW JONES 10-YEAR CYCLE
Year of the decade 1897–2015
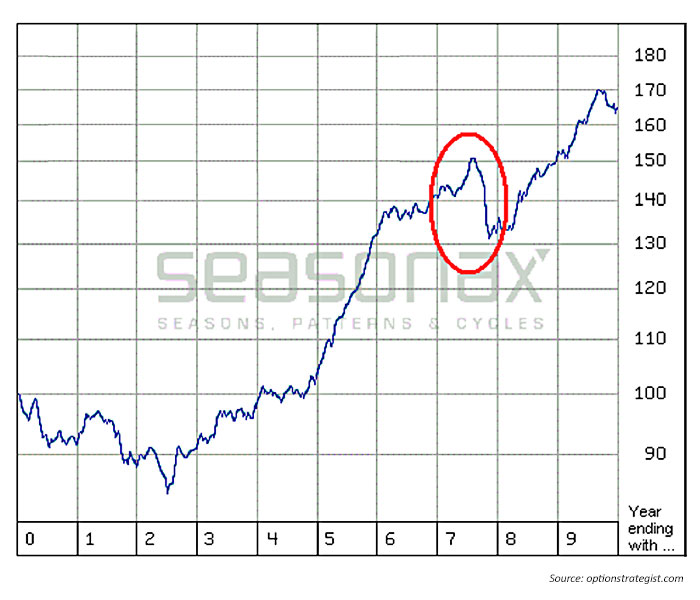
The graph above shows the entire 10-year cycle, with the years ending in “7” circled in red. From the chart, we can see that stock market years ending in “7” generally rally—even rally strongly—into the late summer. But then the wheels come off, and there is a precipitous drop late in the year. By year’s end, there is a loss. Surprisingly, this is not the only year of the decade that shows a loss (“0” and “1” do also).
So, take this as a vague warning of sorts. We will try to remember to revisit this data in the summer of 2017, just to remind ourselves of what has happened in the past.
The opinions expressed in this article are those of the author and do not necessarily represent the views of Proactive Advisor Magazine. These opinions are presented for educational purposes only. This article was first published as part of The Option Strategist Newsletter on Feb. 3, 2017.
 Professional trader Lawrence G. McMillan is perhaps best known as the author of “Options as a Strategic Investment,” the best-selling work on stock and index options strategies, which has sold over 350,000 copies. An active trader of his own account, he also manages option-oriented accounts for clients. As president of McMillan Analysis Corporation, he edits and does research for the firm’s newsletter publications. optionstrategist.com