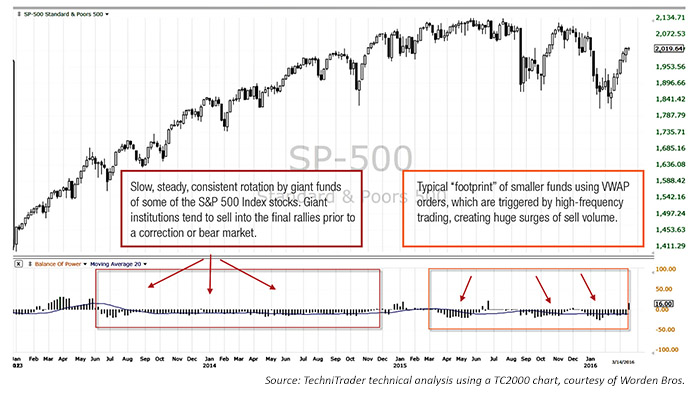
Contrary to popular myth, technical analysis does not predict the market, but instead reflects the current fundamentals. Fundamental data delivered to the public is often stale because it arrives after the month, quarter, or year in which the data was recorded. Giant and large institutions—responsible for the largest mutual and pension funds—have the resources, talent, and power to investigate companies well ahead of any reports issued by a firm to the general public. Though it may appear that technical patterns lead or predict the market, they merely show information that the giant and large institutions already have—current data on the state of financials, company conditions, as well as other factors.
TRADING PATTERNS OF LARGE FUNDS VS. SMALL FUNDS

Consequently, knowing how to read a stock chart in order to find accumulation or rotation patterns created by the giant and large institutions (we have termed this Quiet Rotation) is most important. This provides the opportunity for smaller funds, professionals, and independent investors to buy and sell with these institutions, or shortly thereafter.
Accumulation patterns form when institutions, using private exchanges (or dark pools), automatically and incrementally buy thousands to millions of stock shares using time-weighted average price (TWAP) or other similar automated dark-pool order types. Weighting the order based on time and restricting the price range at which the order triggers provides maximum price control and thereby maintains the current trend as long as smaller lots continue to sell. This type of mass and hidden institutional accumulation of stock pulls liquidity from the market. Initially, this does not disturb a downtrend, nor do smaller funds, which typically use volume-weighted average price (VWAP) orders, know accumulation has started. At some point, accumulation will halt a downtrend and begin the bottoming phase for stocks and indexes.
Rotation patterns form when institutions perform the automated incremental selling of stock shares to lower the stock’s inventory. They sell these shares anticipating that the company’s future quarterly profit-and-loss report will be lower than prior quarters. Rotation tends to start well ahead of the final high for the stock or index, as most tops are caused by heavy and consistent rotation over a very long period of time—often a year or longer. Lack of buyers causes the stock price to collapse under the weight of giant and larger lot sellers. The extent of rotation in charts defines just how serious the correction or weakness in fundamentals may be for that stock.
Understanding these factors when using technical analysis will provide a far better use of chart analysis for investors. The S&P 500 chart example shows rotation patterns of the giant and larger institutions, which started back in the year 2014. Currently the pattern is reactionary selling by smaller funds, as giant institutions have commenced some specific industry accumulation in recent weeks.
 Martha Stokes, CMT, is the co-founder and CEO of TechniTrader and a former buy-side technical analyst. Since 1998, she has developed over 40 TechniTrader stock and option courses. She specializes in relational analysis for stocks and options, as well as market condition analysis. An industry speaker and writer, Ms. Stokes is a member of the CMT Association and earned the Chartered Market Technician designation with her thesis, "Cycle Evolution Theory." technitrader.com
