Fidelity issued a note for clients on June 17, 2020, which outlined a cautious yet largely optimistic view of improvement around the world on economic conditions—and the continued need for risk management in a highly volatile investment environment.
The note stated, in part,
“The sharp recovery in riskier assets reflects abundant liquidity and hopeful expectations about reopening, but the economic outlook remains highly uncertain. Asset market returns are likely to be increasingly affected by both fiscal and monetary policy decisions. The potential for outsized bouts of volatility is likely to remain high—a more cautious near-term portfolio tilt may be warranted. Amid tremendous uncertainty, portfolio diversification is as important as ever.”
The note also included the following key findings regarding where various economies now stand:
United States:
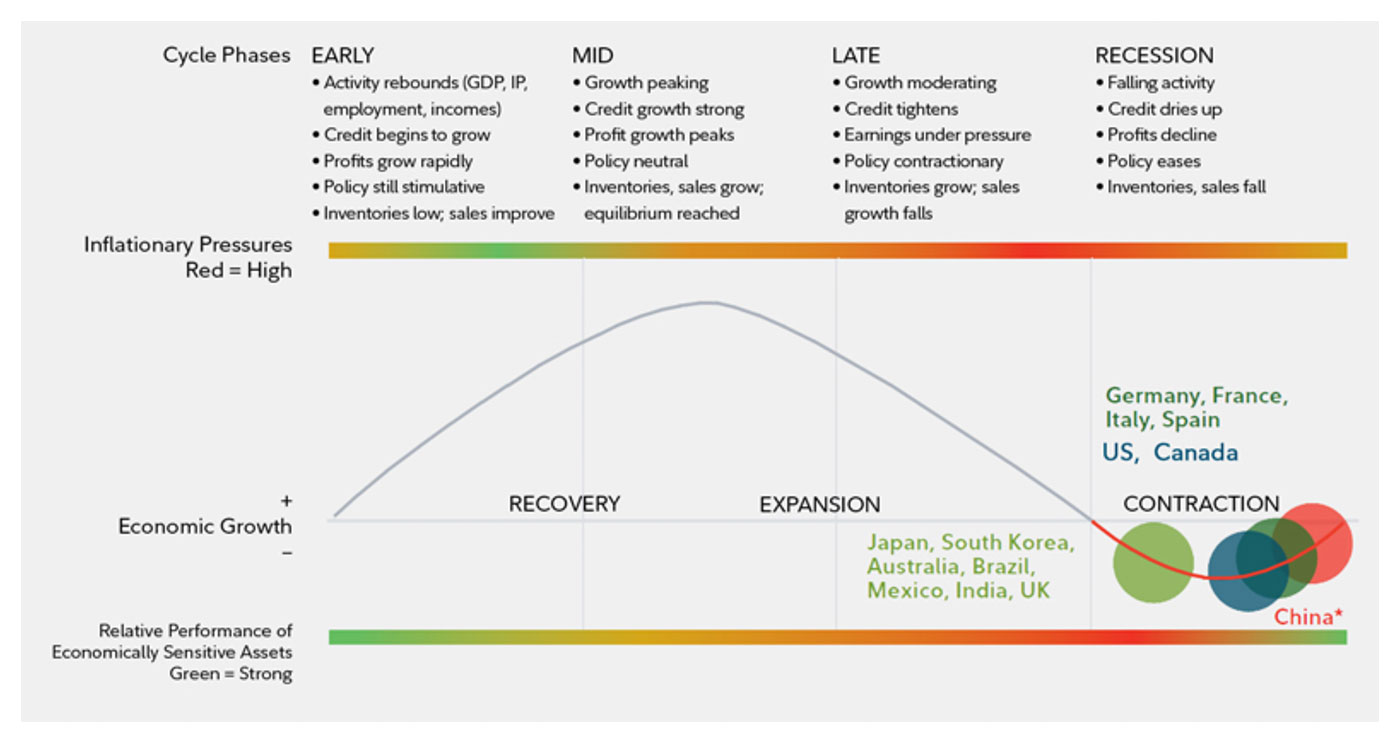
- “The US remains in the recession phase, even as economic conditions have begun to improve from extremely low levels.
- Household and corporate conditions, while significantly weakened by the shock from COVID-19, have been boosted by extraordinary fiscal and monetary support.
- Near term, improvement remains likely as the US continues to ease restrictions.
- The economy remains in a vulnerable state, however, and additional policy accommodation aimed at the household sector may be needed to support its incipient momentum.
- Amid supply-chain disruptions and low demand, the outlook for corporate profits remains weak. Businesses in several sectors are likely to face ongoing solvency concerns.”
Global:
- “We see early signs of improvement in global activity, though the coronavirus shock continues to weigh heavily on manufacturing, trade, and services.
- China’s economy is in a fragile uptrend led by a rebound in industrial activity and increased policy support. Weak demand from the rest of [the] world, a soft recovery in the service sector, and an uncertain property outlook are likely to keep the recovery muted.
- China’s path out of lockdown—as well as initial readings from other countries—strengthens our conviction that the path to normalcy for the US and global economies will be hesitant and uneven.”
Figure 1 presents where Fidelity sees various major economies in relation to the typical business cycle.

Source: Fidelity Investments (Asset Allocation Research Team), as of May 31, 2020
One positive factor for the U.S. economy has been the relative outperformance of several economic data points recently relative to analysts’ and economists’ expectations. This surge in positive data has undoubtedly played a large role in the U.S. equity market’s rebound, along with unprecedented actions taken by the Federal Reserve and U.S. government.
Barron’s wrote this past weekend,
“It makes sense that investors would be skeptical about how quickly the market has run from March lows, given that more than 20 million Americans remain unemployed, corporate earnings are collapsing, and coronavirus cases are back on the rise.
“But upside economic surprises over the past two weeks—mortgage applications hit the highest level since 2008, retail sales rose at the fastest pace ever, and U.S. businesses added 2.5 million jobs in May instead of cutting an anticipated eight million, to name a few—are even better than they look and offer at least some proof that the stock-market rebound was driven by expectations for improving fundamentals. The point isn’t that economic data are improving; of course they are as the economy reopens. It’s about the magnitude of the surprises versus Wall Street’s expectations.”
Tony Dwyer of Canaccord Genuity emphasized the same theme in a recent client update:
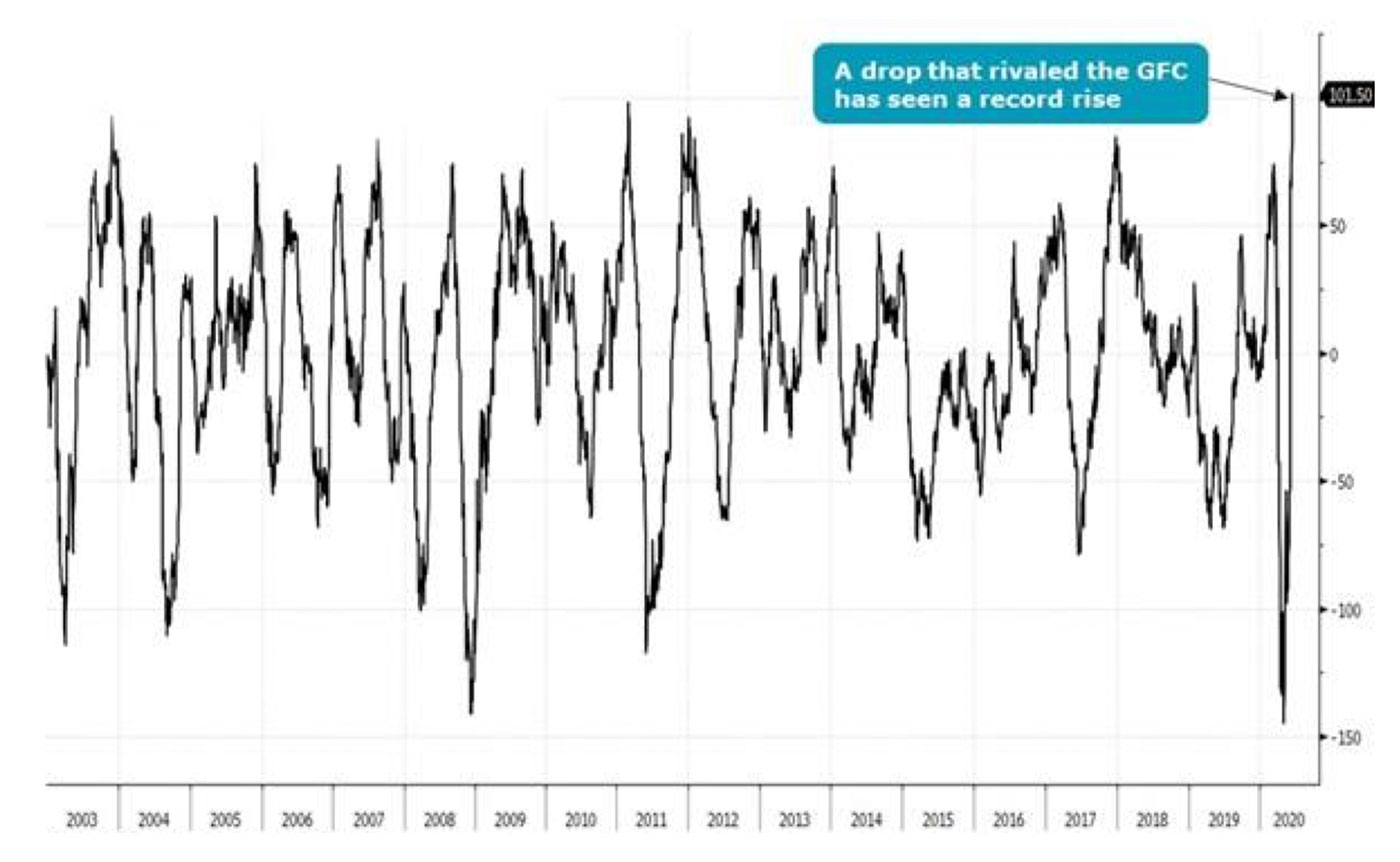
“One reason the market typically accelerates to the downside in a recessionary environment is a fear the economy can keep getting worse. When the government forced a shutdown to contain the risk to the healthcare system, we saw a historic rise in the U.S. unemployment rate and a collapse in nearly every economic data series. As a result, the Citigroup Economic Surprise Index dropped to the lowest level since the great financial crisis (GFC) and within just two months has seen a record rise. Clearly, expectations became overly pessimistic.”

Sources: Bloomberg, Canaccord Genuity; data as of June 15, 2020
Dwyer added in another client note,
“My friends at www.sentimentrader.com conducted a study that showed since 2003, there have been five prior occurrences when the CESI moved above 83 (it closed at a record 101.5 yesterday), and found the S&P 500 (SPX) was higher one and two months later each time by a median 4.7% and 6.5%, respectively. This study reinforces our view to add risk on any bouts of weakness during the current consolidation period. It is important to note the longer-term results were also better coming out of a major decline (2003 & 2011) vs. taking place after a long-term advance, which likely is based on a much more favorable monetary backdrop.”
One major question surrounding this thesis, according to the Barron’s article cited previously, is the outlook for corporate profits. The article noted that many market participants are questioning current market valuations and whether “any forthcoming rise in profit estimates is already baked in.”
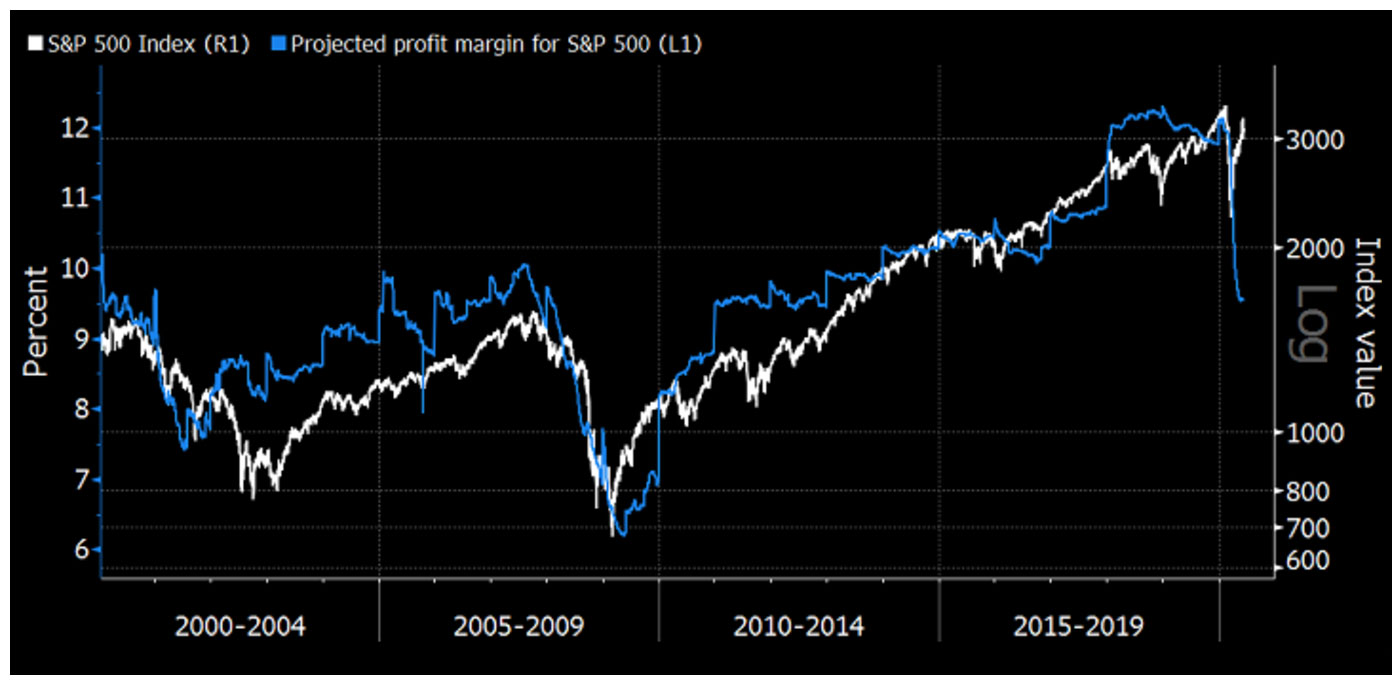
David Wilson at Bloomberg issued a chart last week that shows how profit margins for S&P 500 companies have fallen precipitously. He notes,
“Estimates of U.S. corporate profit margins show ‘how insanely disconnected equity prices are from their underlying fundamentals,’ according to Crescat Capital LLC. The money manager cited the S&P 500 Index’s margin outlook, according to data compiled by Bloomberg, in an investor letter posted on its website Wednesday. Analysts lowered projections for the index’s profit margin, or net income relative to sales, by 2.2 percentage points this year to 9.5% as of Thursday. The margin peaked in January 2019 at 12.3%, the highest level since the data were first calculated in 2000.”

Source: Bloomberg
