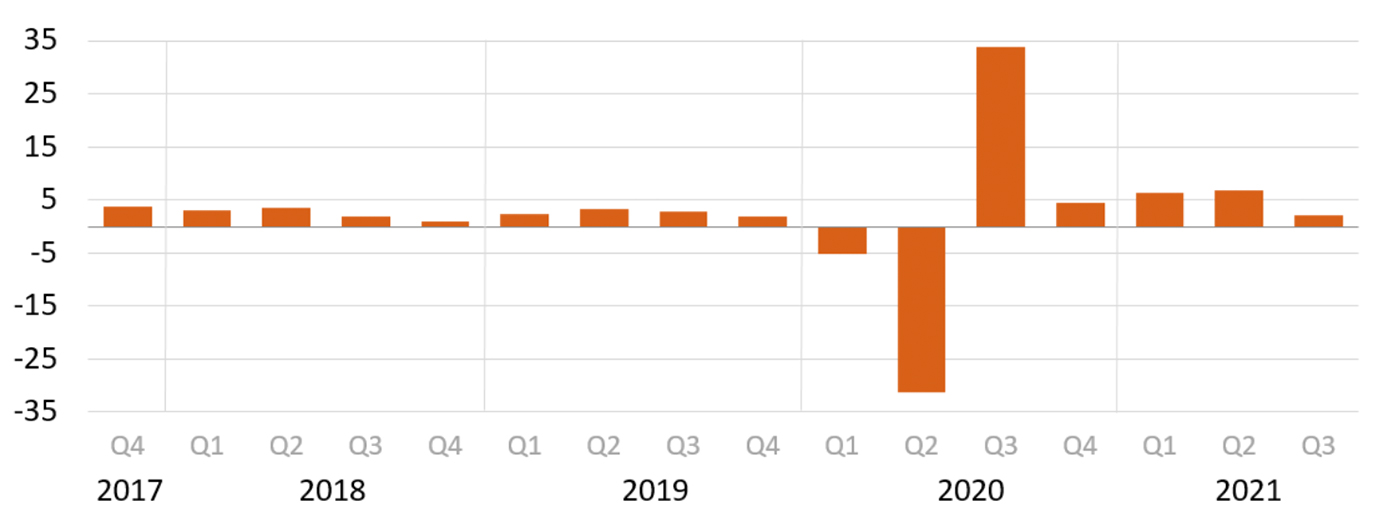
The U.S. Bureau of Economic Analysis (BEA) released its advance look at Q3 2021 GDP last Thursday (Oct. 28), with the projected annual growth rate of 2% below analysts’ expectations for a figure in a range of 2.8% to 3.5%. The 2% growth rate was also well below the 6.7% increase in the second quarter.
The BEA said,

Note: Seasonally adjusted at annual rates.
Source: U.S. Bureau of Economic Analysis
Barron’s wrote about the GDP release,
“The Bureau of Economic Analysis said economic growth in the September quarter reflected the continued economic impact of the Covid-19 pandemic, with a resurgence of infections prompting new restrictions and delays in the reopening of establishments in some parts of the country. The report is the first estimate on quarterly GDP, and the number is likely to be revised in the coming months. The first reading reflects an economy that is slowing as consumer confidence fades, exports fall, and new government spending is in question as budget negotiations remain stuck.”
Bespoke Investment Group noted,
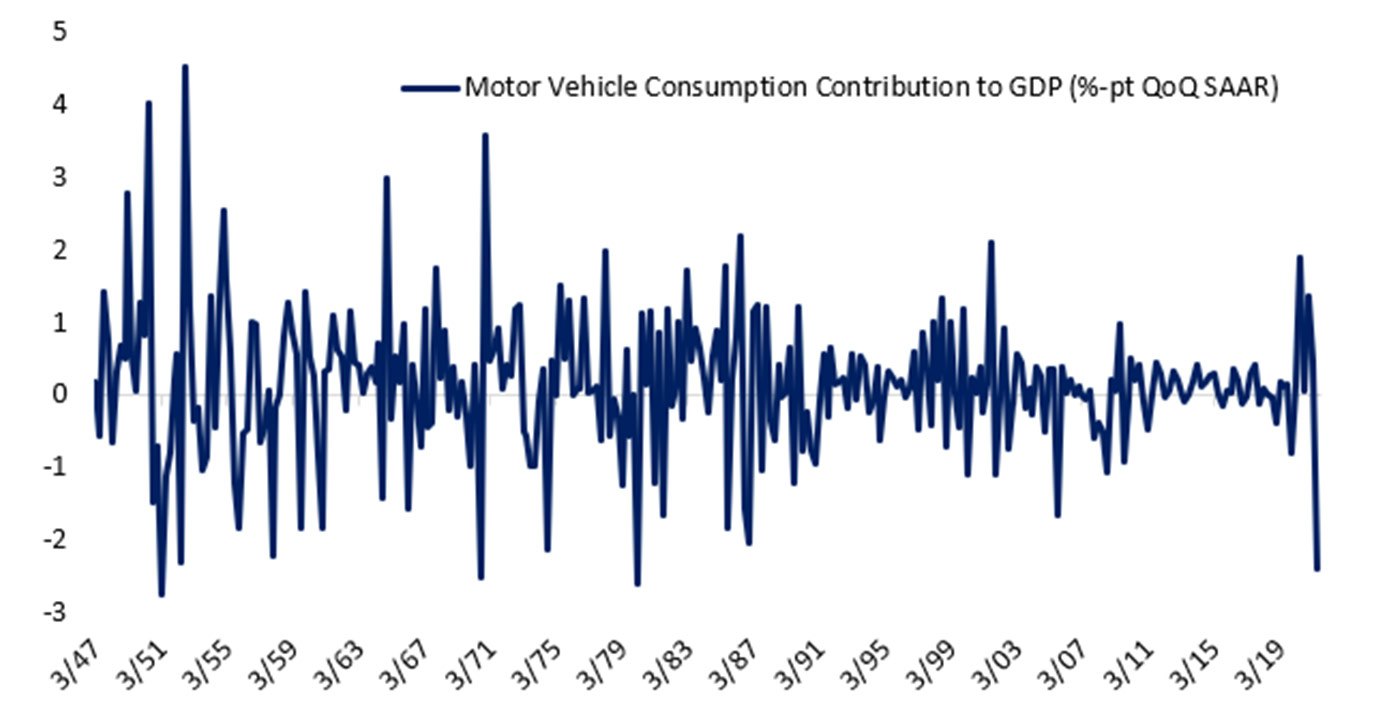
“GDP was dragged down quite dramatically by the auto sector in Q3. Demand has been strong, but supply shortages have led to plunging inventories and huge drops in consumption. The good news is that company reports suggest the semiconductor shortage may be easing. …
“We show the contribution to total GDP growth from auto purchases [Figure 2]. As shown, after soaring during 2020, those numbers have come crashing back to earth as vehicle sales have fallen from an 18.8mm annualized pace to below 13mm in September. The result was the fourth-largest negative impact to GDP from motor vehicle consumption on record.”

Source: Bespoke Investment Group
Against the backdrop of slowing domestic growth in the U.S., Q3 2021 earnings so far have been solid.
As of the end of last week (Oct. 29), FactSet’s key metrics for the Q3 earnings season include the following observations:
- “Earnings Scorecard: For Q3 2021 (with 56% of S&P 500 companies reporting actual results), 82% of S&P 500 companies have reported a positive EPS surprise and 75% of S&P 500 companies have reported a positive revenue surprise.
- “Earnings Growth: For Q3 2021, the blended earnings growth rate for the S&P 500 is 36.6%. If 36.6% is the actual growth rate for the quarter, it will mark the third-highest (year-over-year) earnings growth rate reported by the index since 2010.
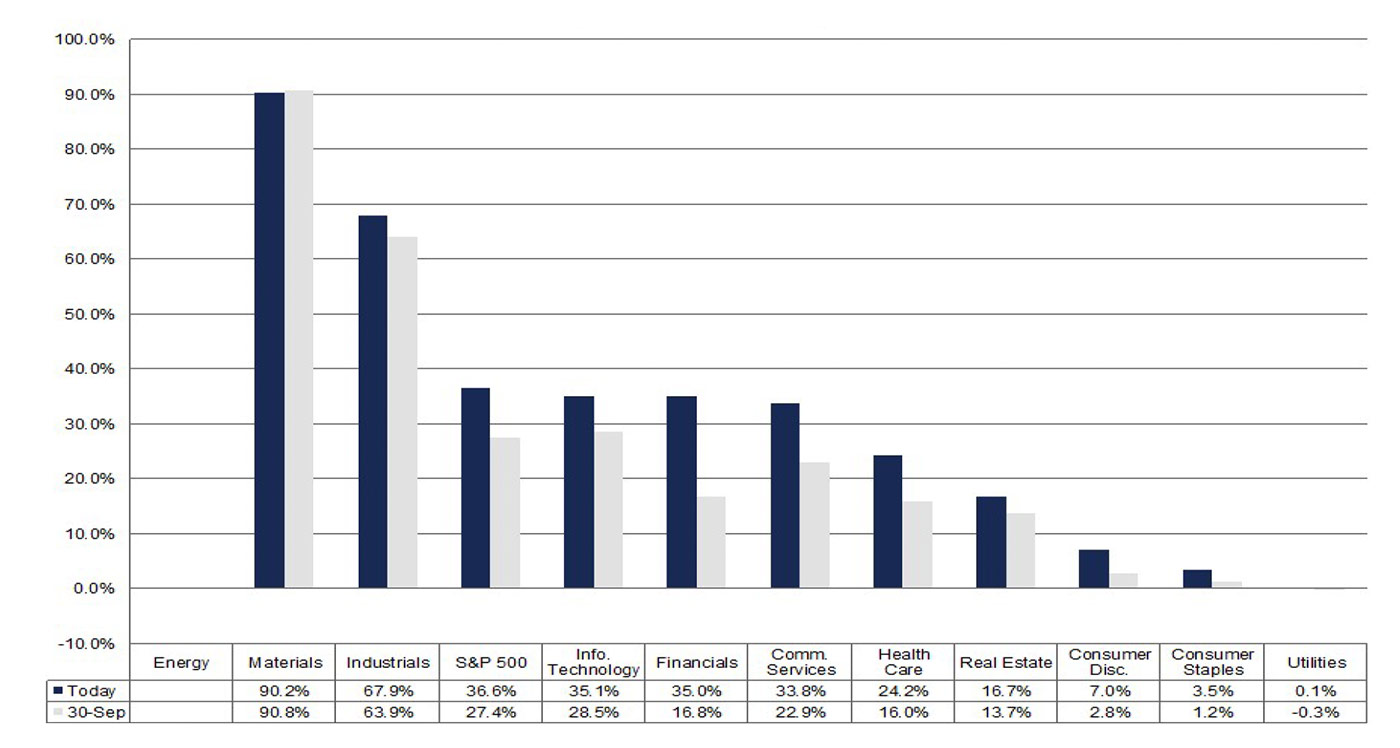
- “Earnings Revisions: On September 30, the estimated earnings growth rate for Q3 2021 was 27.4%. Nine sectors have higher earnings growth rates today (compared to September 30) due to positive EPS surprises and upward revisions to estimates
- “Earnings Guidance: For Q4 2021, 25 S&P 500 companies have issued negative EPS guidance and 15 S&P 500 companies have issued positive EPS guidance.
- “Valuation: The forward 12-month P/E ratio for the S&P 500 is 21.1. This P/E ratio is above the 5-year average (18.3) and above the 10-year average (16.5).”
“The unusually high growth rate is due to a combination of higher earnings in Q3 2021 and an easier comparison to lower earnings in Q3 2020 due to the negative impact of COVID-19 on a number of industries. … All eleven sectors are reporting year-over-year earnings growth, led by the Energy, Materials, Industrials, Information Technology, Financials, and Communication Services sectors.”

Note: The Energy sector is coming off a loss in Q3 2020, preventing a mathematical projection for earnings growth.
Source: FactSet
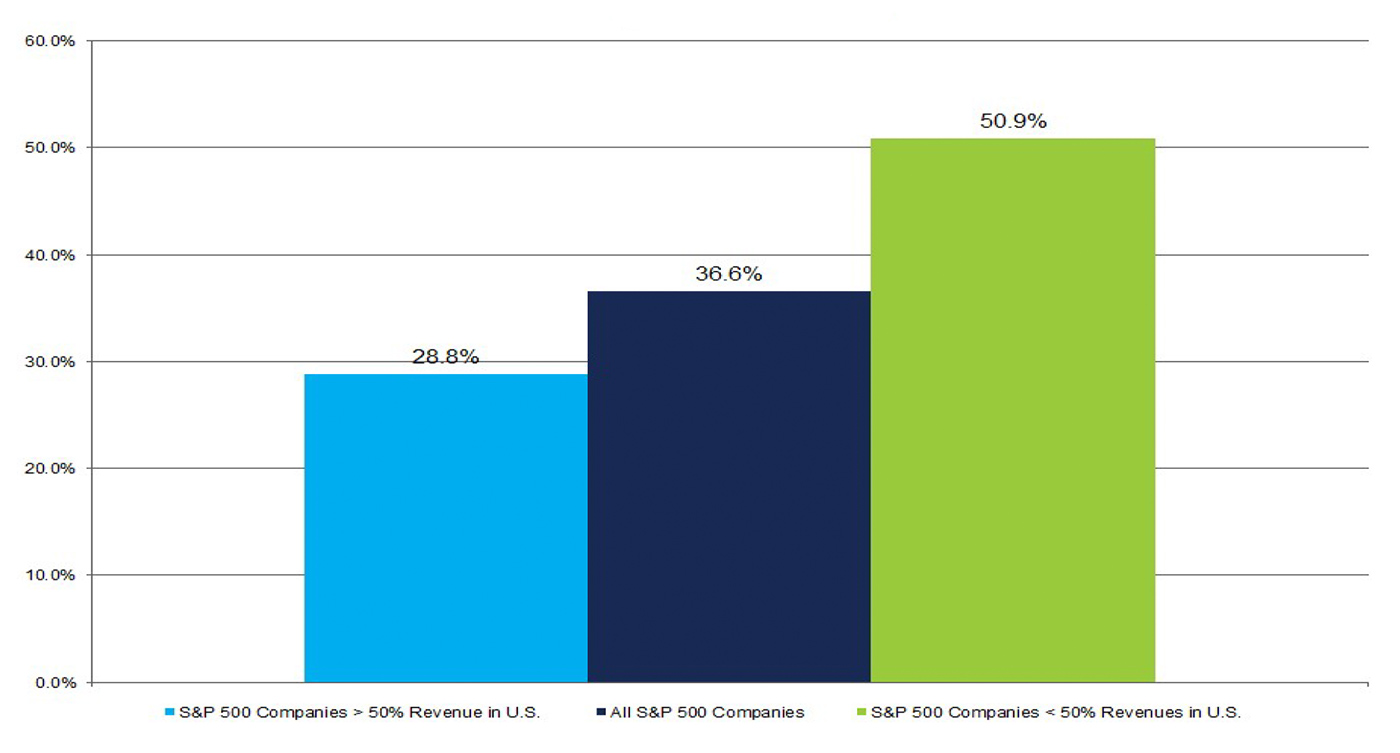
FactSet has found a large earnings differential dependent on international exposure, stating,
“Companies with more international revenue exposure are reporting higher earnings growth than companies with more domestic revenue exposure. For companies that generate more than 50% of sales inside the U.S., the blended earnings growth rate is 28.8%. For companies that generate more than 50% of sales outside the U.S., the blended earnings growth rate is 50.9%.”

Source: FactSet
