

Fundamental analysis is the foundation of stock investing and continues to be the number one source of data for selecting stocks by giant institutions, market professionals, managers of small funds, and retail investors. However, the quality of fundamental data and the timeliness of that data are not the same for each of these market participant groups.
The retail investor often receives data from financial reports after the information has already been acquired by institutions and market professionals.
Major institutions—responsible for the largest mutual and pension funds—have the resources, talent, and power to investigate companies well ahead of any reports issued by a firm to the general public. Though it may appear that technical patterns lead or predict the market, they merely show information that the giant and large institutions already have—current data on the state of financials, company conditions, as well as other factors. (See my Proactive Advisor Magazine article from March 17, 2016, “Identifying the buying/selling patterns of large institutions and why it matters.”)
The result is a huge discrepancy between when retail investors and institutions buy or sell a stock.
One advantage that retail investors now have is that fundamental data is available in a graphical form from many sources. This is possible due to advances in both data collection and software. Skilled technical analysts use market data for analyzing the technical, or price and volume action, of a stock over time.
Fundamental line indicators are drawn by a computer on a stock chart to show what the fundamental data was for that period of time. There are hundreds of pieces of fundamental data that can be graphed in this manner.
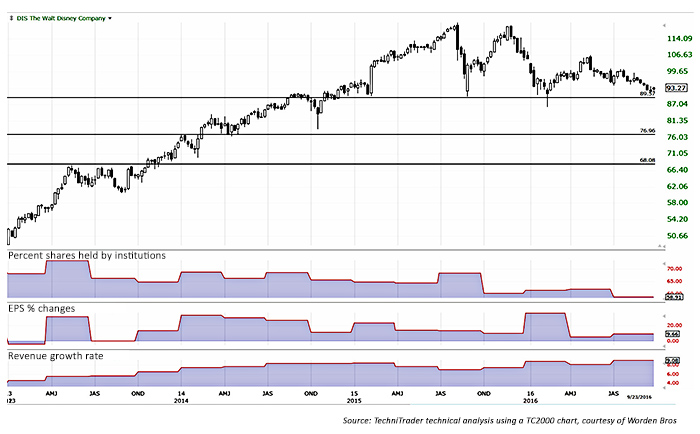
The following example for the Walt Disney Company (DIS: NYSE) includes three commonly used fundamental line indicators in the chart windows below the price trend.
PRICE TREND FOR DISNEY (DIS) VS. KEY INDICATORS
Using these indicators can be a huge benefit to technical analysts and investors of all levels, allowing them to see graphically over time what has been going on with the fundamentals of a company. Using graphs to show the data patterns can help investors make better decisions about when to buy, hold, or sell.
The Disney chart shows that institutions once held over 73% of all the outstanding shares. Now that number has dropped to 58%, which is significant. The “percentage shares held by institutions” (PSHI) data comes from the monthly report that all institutions are required to submit to the Securities and Exchange Commission.
Earnings (EPS) percent change data can also be drawn as a fundamental line indicator over time. Earnings percent change shows the percentage of change in EPS over time. There is a lower percentage for DIS over recent periods that is coincident with a lower stock price.
The relationship between the data seen on the graph and stock chart is important, as most technical analysts would tell you this looks to be a topping action. This means that institutions have been rotating out of DIS for some time, even while “uninformed” retail investors have been buying, unaware of the institutions’ sell sentiment.
Revenue growth rate is another fundamental line indicator. It reveals that DIS has had a fair amount of inconsistency in revenues, with a marked decline in 2015. That is likely the cause of the institutional rotation that has continued throughout 2016. When there is more selling by the larger lot institutions against smaller lot retail investor buying, there is more pressure on the stock price to move down.
The fundamental data is irrefutable, as it is from the audited financial records of the company being studied. The chart merely reflects the changes in a graphical format that is easier to interpret and understand than just looking at earnings reports.
Summary
Investors of all levels can now use fundamental data in their stock chart analysis, providing a graphical perspective of what has been going on with the company in the recent past. This is also often reflected in the stock price and can aid investors in deciding when to buy, hold, or sell. This is an important tool for investors to learn to use. All too often, small lot retail investors and managers of small funds are buying when they should be selling, and selling when they should be buying.
Disclosure: All statements are the opinions of TechniTrader, its instructors and/or employees, and are not to be construed as anything more than opinions. Examples presented are for educational purposes only.
 Martha Stokes, CMT, is the co-founder and CEO of TechniTrader and a former buy-side technical analyst. Since 1998, she has developed over 40 TechniTrader stock and option courses. She specializes in relational analysis for stocks and options, as well as market condition analysis. An industry speaker and writer, Ms. Stokes is a member of the CMT Association and earned the Chartered Market Technician designation with her thesis, "Cycle Evolution Theory." www.technitrader.com