


Looking at Dow 30 technical patterns, and the index’s 30 company component stocks, an entirely different picture emerges. The advantage of stock charts is the ability to see price or value in a graphical form that presents empirical evidence of reality.
The Dow 30 technically is at an extreme “angle of ascent” on the weekly chart view. These extremely steep price runs upward are like an airplane ascending into the sky too swiftly. Most technical analysts know that this type of severe gain is unsustainable.
The following chart illustrates the Dow 30 chart on a weekly basis, where each candlestick represents one week’s worth of data. This expresses price in a manner that makes sense of what is going on with the index’s component stocks.
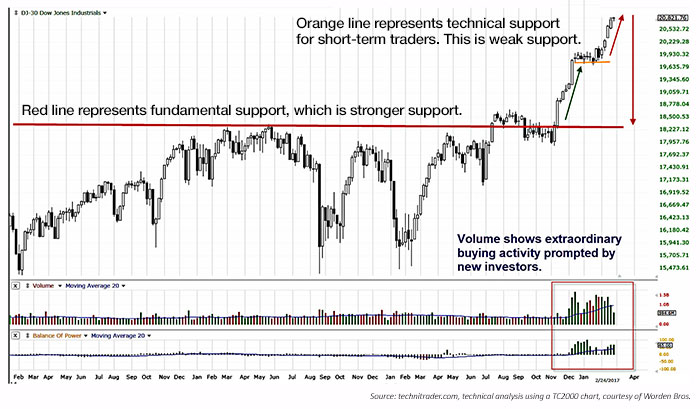
The chart has a strong fundamental support at prior year highs when stock prices were below fundamental values. The angle of ascent of recent prices is shown with a green arrow. The red arrow on the far right points to the distance between fundamental support and current Dow 30 value for the index. Volume is excessively high, and new investors, who are assuming this is the beginning of a new bull market, are rushing to buy.
The denser the candlesticks, the more “support” for the index at that level of price. This relates precisely to fundamentals, which are an underlying key factor in price increases or decreases over time. When financial statements show less revenue growth or a decline in earnings, prices usually have already started to decline as the buy-side institutions know this information ahead of time. Charts simply reveal the rotation patterns of the buy-side institutions that occurred before the news was released to the general investing public.
Gains are not always tied to higher revenues and earnings. Gains can simply be speculation due to new investor greed and euphoria. If the gains in stock prices lack substantial financial and fundamental substance, then vertical rises start to appear on the index charts.
This is currently true for the Dow 30. Gains in stock values for some of the Dow 30 stocks greatly exceed the fundamental business cycles and latest financial statements.
What is unique about this particular Dow 30 “rally,” as the retail news often calls it, is that only a handful of the Dow 30 components account for this sudden velocity acceleration of the index.
Currently these Dow 30 components are below the highs of 2014–2016: WMT, INTC, JNJ, NKE, PFE, VZ, GE, DIS, UTX, KO, CAT, PG, IBM, AXP, CVX, and XOM. That represents 16 of the 30 components. As would be expected, XOM and CVX have declining year-over-year revenues. What is interesting is that the bulk of these companies show flat to higher year-over-year revenues.
These stocks are at new all-time highs: JPM, HD, BA, MCD, V, UNH, DD, AAPL, MSFT, and GS. These 10 firms have moved up substantially and continue to be bought at record highs. Checking their financial statements for the year, only HD, BA, and UNH show higher revenues than last year. Earnings are not considered in this equation because earnings can be and are manipulated to enhance the earnings figure. It is a simple matter of capitalizing expenses to improve an earnings report. Revenues are a better test of growth for a company when analyzing year-over-year data.
The remaining four companies—MMM, TRV, MRK, and CSCO—are in sideways patterns or a trading-range pattern. All four companies have either flat or lower year-over-year revenues.
What this technical to fundamental analysis reveals is that stocks that have exceeded their all-time highs or are near their all-time highs generally do not have the fundamental basis for those gains.
Fundamentals confirm what the technical analysis shows us: The Dow 30 has been in a speculative buying mode for several months. A few components are moving the value of the index up, and those firms do not have the fundamental basis for those gains.
This scenario between technical and fundamental patterns occurs as a bull market ages. In our opinion, retail investors who lack knowledge about business cycles, the stock market, or how to invest wisely, are buying with blinding euphoria. This is always the first stage of the final speculation that enters most bull markets before a bubble and inevitable collapse as prices exceed all rational valuations. For savvy retail investors and accredited investors, this is a wake-up call to tighten stop losses and prepare for a market correction when the buying frenzy suddenly disappears. This occurs when new investors run out of capital to buy stocks.
All statements presented in this article are the opinions of TechniTrader, its instructors, and/or employees, and are not to be construed as anything more than opinions. The opinions expressed in this article do not necessarily represent the views of Proactive Advisor Magazine. Examples presented are for educational purposes only.
 Martha Stokes, CMT, is the co-founder and CEO of TechniTrader and a former buy-side technical analyst. Since 1998, she has developed over 40 TechniTrader stock and option courses. She specializes in relational analysis for stocks and options, as well as market condition analysis. An industry speaker and writer, Ms. Stokes is a member of the CMT Association and earned the Chartered Market Technician designation with her thesis, "Cycle Evolution Theory." www.technitrader.com