
Wow! Time flies. This marks my 20th article for Proactive Advisor Magazine in six years.
We are now into that quirky time of year for the market, namely the last two weeks of September and the first two weeks of October. Drawdown and gyrations happen more consistently at this point than any other time of the year—going back to the days of cave drawings.
What to do?
At Smooth Sailing Indexes, we create high-alpha strategies by learning to circumvent most of the ugly ahead of time by creating indicators and observing asset-class relationships.
I’ll share one.
This time of year, along with other unpredictable, predictable, or plain old goofy times in the markets, does not seem to bug this combination of ETFs too much.
I’m talking about a mix of SPY, TLT, and GLD. You can equal weight them, but I prefer reducing the market-biased 60% from the equity piece and giving 20% to GLD—and to create more balance, I leave the 40% in TLT.
Seems lazy. It is. But clients can tolerate a lazy advisor if the slope of their equity curves is pointed in the right direction. I’m not trying to sound provocative—it is mathematical language.
Yep, many clients are addicted to slope. And in only one direction.
So, that puts pressure on most advisors to make sure that the slope remains positive—and when it is not, plead with the client to be patient until the desired slope returns. The problem is that too much positive slope generally reverts to the mean. This requires the pain of traveling down a negative slope. During this period, some difficult clients associate the drawdown with failure no matter how much of a run-up in portfolio value they may have experienced in the past. This is a real quandary for the advisor—who often lives in a “what have you done for me lately” relationship with the client.
So, there are two choices: 1. You can set expectations and remind the client that stuff goes up and stuff goes down and hope they trust you enough to stick with the plan. 2. You can carefully pick combinations of uncorrelated asset classes to reduce the amount of positive and negative slope.
Why would anyone want to limit positive returns? To smooth out overall returns.
How? Set the “bandwidth.” (More on this below.)
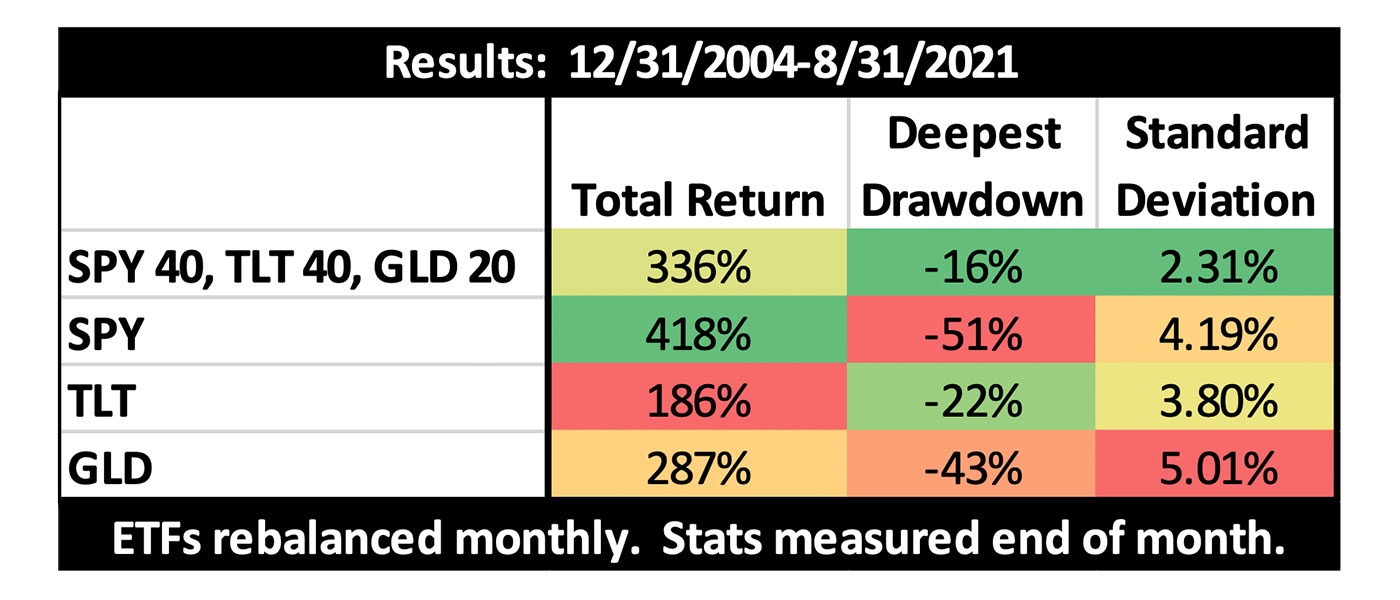
The results of a monthly rebalancing of 40% SPY/40% TLT/20% GLD are compelling—and it would be easy for a client to observe this and relieve you of your duties unless you add value. That is why using a specific methodology and time frames make your services more valuable in the scenario being presented.
Table 1 reviews results over a long period of a portfolio strategy consisting of 40% SPY/40% TLT/20% GLD.

Source: Smooth Sailing Indexes
One way that value can be added is through an active approach of setting “bandwidth.” This is relatively simple.
If the return at end of any given month is less than X or more than Y, then sell and retreat to your safe haven (like cash or short-duration Treasury ETFs such as SHV or BIL). That’s it.
As an example, if you have a client with moderate risk tolerance, you can set the parameters at the end of the month to sell if the return is <=-7% or >=7%. You have set the return into a 14% bandwidth.
In that scenario, the end-of-month drawdown of the combo is still -16%, but the return increased to 360% and the standard deviation reduced to 2.18%. This is because you either avoided a steeper drawdown through active management or sold after a huge run-up. Not bad in either case.
If you have a conservative client that needs some market exposure, you can drop the negative parameter to <=-2% and the positive to >=2%. Boom, you still return 238% with a -7% max drawdown and 1.65% standard deviation. The point is, you, the advisor, oversee the bandwidth amount based on a client’s risk tolerance and/or expectations.
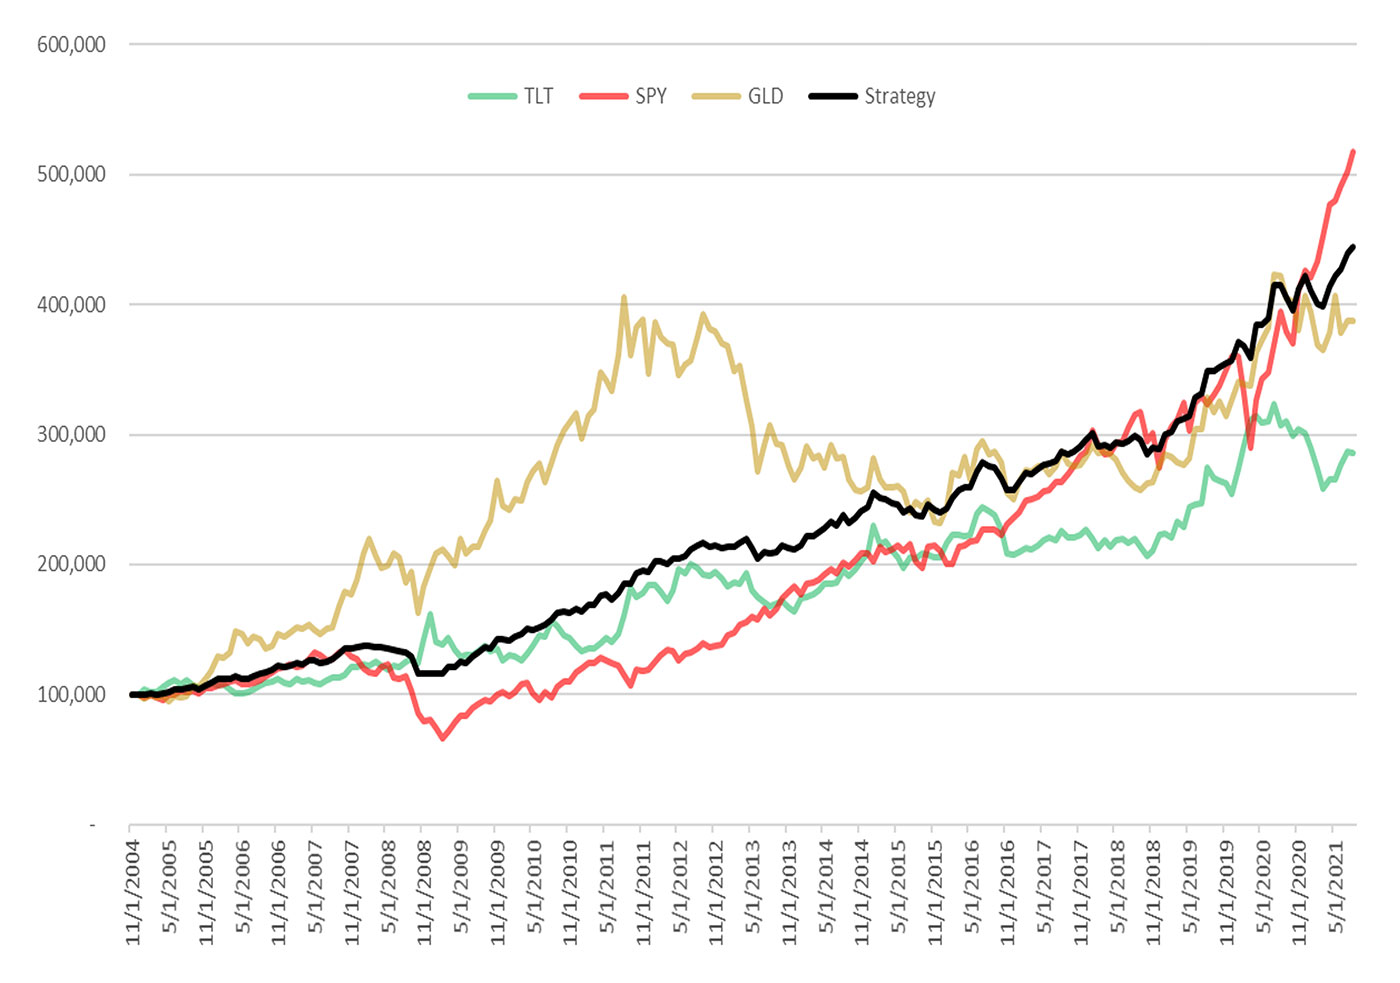
Take a close look at Figure 2 where the bandwidth parameters used are <=-5% and >=5% for the blended strategy compared to the individual components of SPY, TLT, and GLD.
Which line has the smoothest overall slope? I think that should satisfy your clients—whether they are “addicted” to slope or not.

Source: Smooth Sailing Indexes
 Ian Naismith is a partner and the index designer of Smooth Sailing Indexes Inc., which is a leader in tactical “risk-on/risk-off” index development. Mr. Naismith has been analyzing and trading the markets since the early 1990s. He is a member of the National Association of Active Investment Managers (NAAIM) and has also served as board member and president. www.smoothsailingindexes.com
