Crude oil says stocks are heading for an unpleasant time
Crude oil says stocks are heading for an unpleasant time

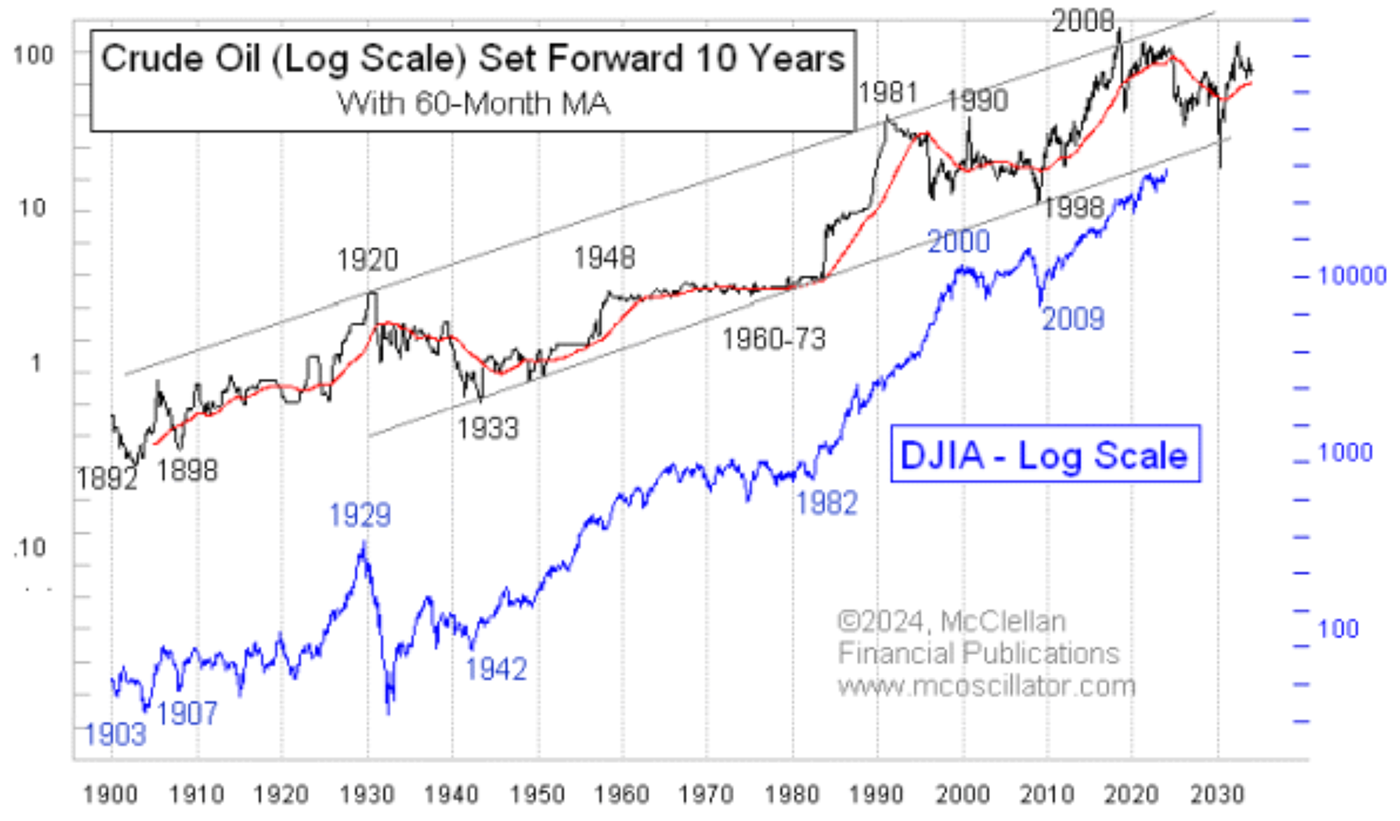
Years ago, I discovered the fun relationship shown in Figure 1. The chart reveals how the movements of crude oil prices tend to show up again as stock price movements about 10 years later. I do not have a good explanation for why this relationship works, but it has been working for the most part ever since the Dow Jones Industrial Average (DJIA) was first created in 1896. At some point, when there is this much evidence, one can let go of the quest for the “why” and accept the “is.”
FIGURE 1: HISTORICAL RELATIONSHIP OF CRUDE OIL PRICES VS. DJIA

Source: McClellan Financial Publications
If you plan to use this model, it’s crucial to understand a few key points. The first is that the 10-year lag isn’t always precisely 10 years. Sometimes, the stock market’s actual turns vary from that ideal lag time by a few months. For instance, crude oil prices bottomed in November 1998, while the corresponding stock market bottom was in March 2009—five months longer than the ideal 10-year lag time.
Another important point is that the magnitudes of crude oil’s movements do not necessarily get echoed by the stock market. This model is more about the timing of the turns than their severity.
Occasionally, an external event can come along and disrupt things. The March 2020 COVID crash seemed to have blindsided crude oil, but afterward, the major equity averages worked extra hard to get back on track. Another example took place in 1990–1991, when oil prices briefly doubled after Iraq attacked Kuwait, only to swiftly return to their previous levels. Stocks did not mirror that unusual spike.
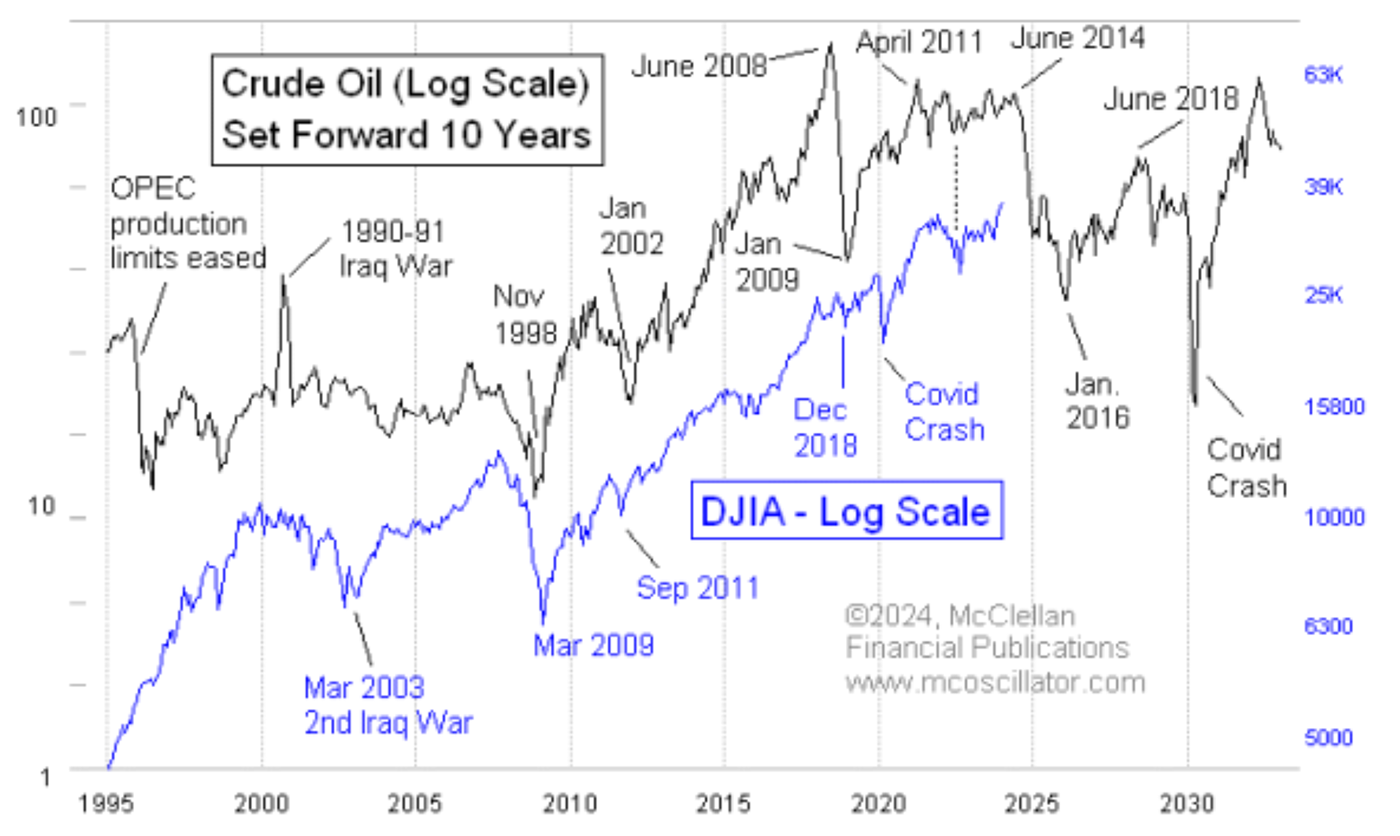
This relationship between oil prices and stock prices is always important, but especially so this year because of what happened to oil prices 10 years ago. In 2014, the fracking boom was underway in the U.S., and OPEC was trying to cut output to stabilize prices despite that big new supply. OPEC gave up that fight in the summer of 2014, and oil prices fell hard. Figure 2 provides another view of the relationship shown in Figure 1, with a focus on recent years.
FIGURE 2: RECENT HISTORY OF CRUDE OIL PRICES VS. DJIA

Source: McClellan Financial Publications
Oil prices fell off a cliff between June 2014 and January 2016. If the 10-year pattern continues as it has worked for more than a century, that would mean a big decline for the stock market between June 2024 and January 2026.
What we do not know is the extent of such a move in the stock market, as magnitudes do vary. In 2018, stock prices did echo the crash in oil prices that accompanied the collapse of the generalized commodities bubble in 2008, but it was far less dramatic. The December 2018 market bottom was almost exactly 10 years after the January 2009 crude oil bottom. Magnitudes can also vary in the opposite direction: The enormous bear market of 1929–1932 unfolded on schedule, echoing the collapse of the Texas oil boom, which started in 1920. But the stock market fell much harder than oil had suggested.
Based on this model, I feel pretty confident that the period between June 2024 and January 2026 won’t be great for the stock market—and also for whoever wins in the November 2024 elections. But I do look forward to the big bull market this model says is coming between 2026 and 2028.
The opinions expressed in this article are those of the author and the sources cited and do not necessarily represent the views of Proactive Advisor Magazine. This material is presented for educational purposes only.
This is an edited version of an article that first appeared at McClellan Financial Publications on Feb. 22, 2024.
 Tom McClellan is the editor of The McClellan Market Report newsletter and its companion, Daily Edition. He started that publication in 1995 with his father Sherman McClellan, the co-creator of the McClellan Oscillator, and Tom still has the privilege of working with his father. Tom is a 1982 graduate of West Point, and served 11 years as an Army helicopter pilot before moving to his current career. Tom was named by Timer Digest as the #1 Long-Term Stock Market Timer for both 2011 and 2012. mcoscillator.com
RECENT POSTS


