Benchmarking the performance of diversified portfolios
Benchmarking the performance of diversified portfolios

It makes little sense for clients—or advisors—to compare investment performance to a single benchmark bearing little resemblance to their actual portfolio allocations. There is a better way to benchmark multi-asset-class portfolios.
What’s a “reasonable” return for a diversified, multi-asset-class investment portfolio? Or, said differently, how do I know if my portfolio, or my client’s, is measuring up? Simple single-asset-class indexes won’t get the job done—at least, not correctly.
If a portfolio is primarily invested in cash, the performance of the 90-day Treasury bill would be a useful reference point. An all-bond portfolio would logically be benchmarked against a bond index such as the Bloomberg U.S. Aggregate Bond Index. An all-U.S. large-cap stock portfolio could be measured against the S&P 500 Index.
The performance of such well-known indexes can serve as a benchmark, or point of reference, for those particular and singular asset classes. However, single-asset-class indexes are not representative of multi-asset-class “real life” portfolios. The key here—in the world of investments—is selecting a benchmark that is reasonably similar to the portfolio being measured against it. This often does not happen because virtually all indexes focus on one asset class (large-cap stocks, mid-cap stocks, bonds, commodities, etc.). This presents a significant challenge when attempting to gauge the performance of broadly diversified, multi-asset-class portfolios.
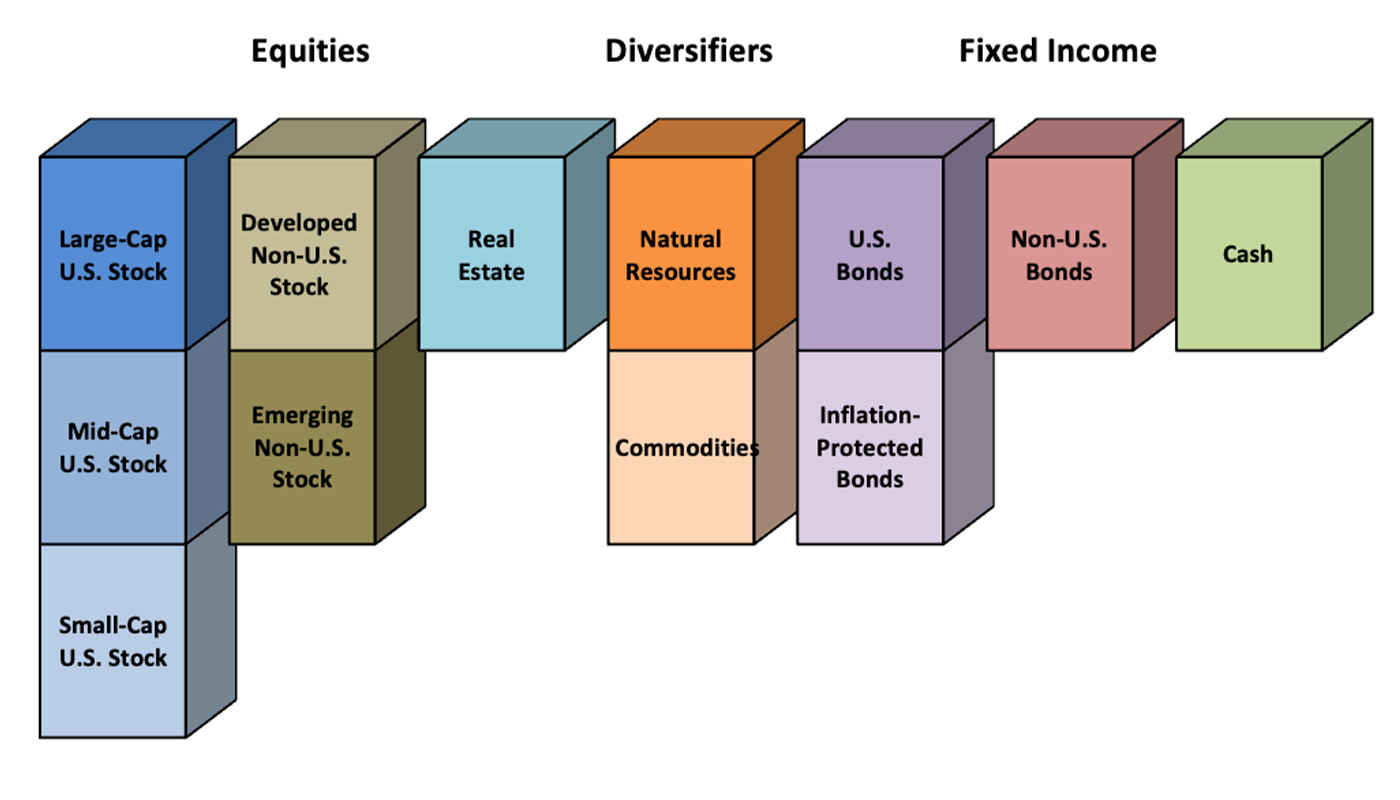
For example, the performance of a diversified portfolio that contains stocks, bonds, and diversifying asset classes such as real estate and commodities is often compared against the S&P 500 Index—an index that contains only large-cap U.S. stocks. At first blush, this may seem reasonable because the S&P 500 Index is a well-known index. Here’s the problem: The S&P 500 Index is very unlike a broadly diversified, multi-asset-class portfolio. Using the S&P 500 Index as the de facto performance benchmark for a wide variety of investment portfolios is analogous to comparing salsa to one of its ingredients, say tomatoes. Salsa does indeed contain tomatoes, but it also contains a variety of ingredients that make it—collectively—quite different from any of its individual ingredients. As shown in the following figure, a multi-asset-class portfolio requires a diversified multi-index performance benchmark.
BENCHMARKING 101
Diversified portfolios require an appropriately diversified benchmark—such as the 7Twelve Diversified Index Model, which has 12 components.

Of indexes and investors
The solution to incorrect benchmarking is not very complicated. Assemble a group of indexes that approximate the asset classes in an actual portfolio and use that as the performance benchmark. It takes a little work but is worth the effort.
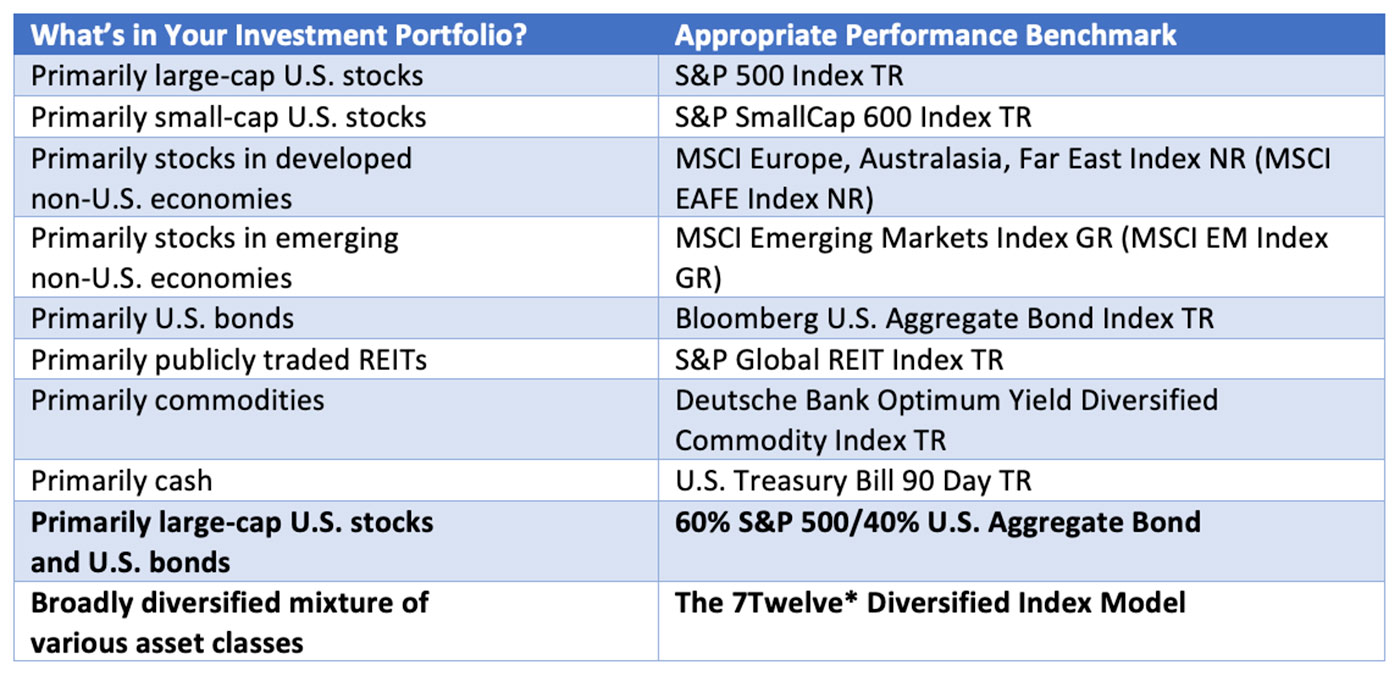
The following table includes indexes that could serve as performance guides for various individual asset classes—perhaps useful for gauging the performance of single-asset-class portfolios that lack broad diversification.
BENCHMARK MENU
Appropriate indexes for various types of portfolios

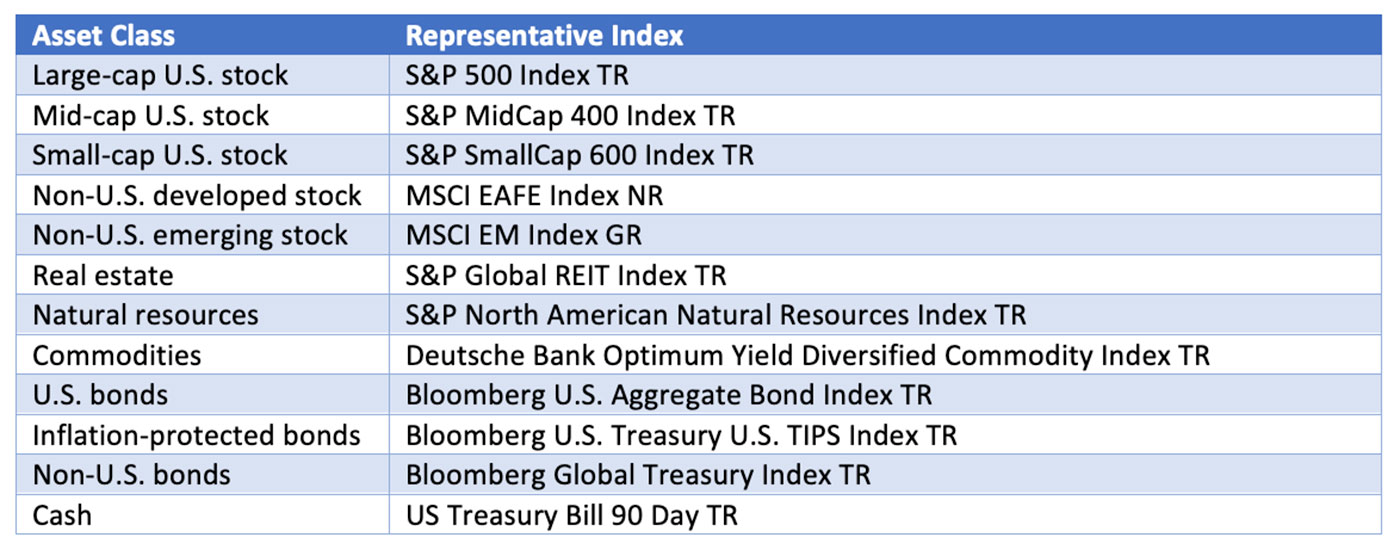
*The 7Twelve Index has an 8.33% allocation to each underlying index and can be rebalanced monthly, quarterly, or annually. 7Twelve is a registered trademark of Craig L. Israelsen, Ph.D.
At the bottom of the table are two multi-asset-class indexes that are more appropriate for a great many portfolios: a simple two-index 60% large-cap equity/40% fixed income benchmark and a 12-index benchmark with a 42% equity/25% diversifier/33% fixed income asset allocation. These multi-asset-class indexes are far more relevant than single-asset-class indexes (such as the S&P 500 Index or the MSCI EAFE Index) because advisor-built portfolios generally include multiple asset classes.
Very simply, a multi-asset-class portfolio (think salsa here) should be compared against a multi-asset-class index—or, in other words, a multi-asset-class benchmark.
If an investor’s portfolio includes a wide variety of asset types—such as large-cap U.S. stock, mid-cap U.S. stock, small-cap U.S. stock, non-U.S. developed stock, emerging stock, real estate, natural resources, commodities, U.S. bonds, Treasury inflation-protected securities (TIPs), non-U.S. bonds, and cash—a more useful performance benchmark is a combination of relevant indexes weighted comparably to the actual portfolio.
Enter the 7Twelve diversified index—a model that I developed in the spring of 2008 to do exactly what we’re talking about here. That is, to serve as a benchmark for diversified investment portfolios. The 7Twelve diversified index model is a combination of the following 12 asset classes and corresponding 12 indexes:
7TWELVE DIVERSIFIED INDEX MODEL

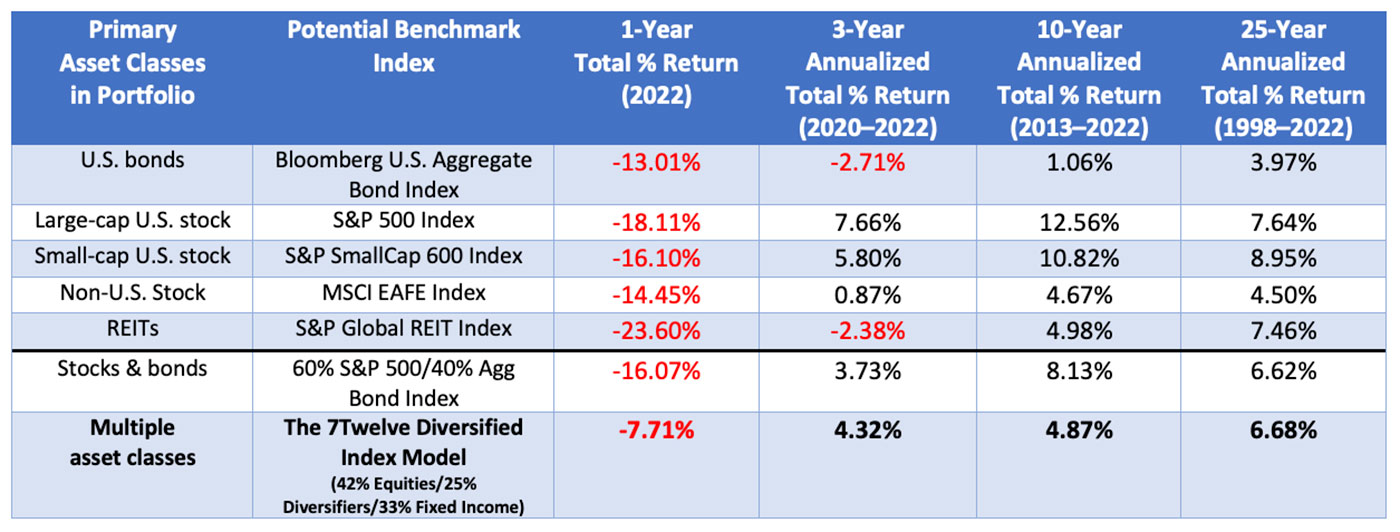
In 2022, the 7Twelve diversified index model produced a total return of -7.71% (assuming annual rebalancing among the 12 underlying indexes). Turns out that was impressive performance relative to the other indexes listed in the “Benchmark Performance” table below. But that doesn’t really matter. What matters is choosing a benchmark index that is comparable to your actual portfolio. The 7Twelve diversified index model seeks to characterize the type of performance that a broadly diversified investor likely experienced over the past three, 10, and 25 years.
So, what’s been a reasonable level of performance for a broadly diversified portfolio over the past 10 years? About 5%. How about over the past 25 years? About 7%. Using a diversified benchmark index facilitates a more accurate understanding of how a diversified portfolio likely behaved recently. The S&P 500 is not that index.
It’s worth noting that the various historical returns (three-, 10-, and 25-year) of the 7Twelve diversified index model are considerably less erratic over the various time frames than the other prominent indexes highlighted in the table. That’s a good thing because it helps clients maintain realistic and stable expectations going forward.
When clients have realistic, reasonable, and stable expectations, that’s also a really good thing for advisors. Ultimately, a more appropriate benchmark index is simply an important step toward the best benchmark of all—which is when a client is gauging the performance of his or her portfolio as it relates to meeting specific financial goals.
BENCHMARK PERFORMANCE
Performance benchmarks for various portfolios over the past 25 years

Source: Steele Mutual Fund Expert, calculations by author. 60/40 portfolio and 12-index portfolio were rebalanced annually.
The opinions expressed in this article are those of the author and do not necessarily represent the views of Proactive Advisor Magazine. These opinions are presented for educational purposes only.
 Craig L. Israelsen, Ph.D., is an investment strategist, educator, and author. His primary research interest is the analysis of mutual funds/ETFs and the design of investment portfolios. Dr. Israelsen is the developer of the 7Twelve Portfolio (www.7TwelvePortfolio.com) and the author of three books. He has been a frequent contributor to major national financial publications and has taught at Brigham Young University and the University of Missouri-Columbia. Dr. Israelsen is now an executive-in-residence at Utah Valley University in the personal financial planning program. He holds a Ph.D. from Brigham Young University.
