Behavioral biases: ‘I’ll see it when I believe it’
Behavioral biases: ‘I’ll see it when I believe it’

Data will normally regress to the mean or average, yet investors often remain “anchored” to recent trends. Dynamic, risk-managed strategies are designed to help investors stay prepared—no matter what their current bias.
Some time ago, I listened to an interview on Bloomberg radio with Thomas Gilovich, a well-known professor of psychology at Cornell University. He has conducted research in social psychology and behavioral economics, with a focus on human biases in decision-making. He is the author of several books, including “How We Know What Isn’t So: The Fallibility of Human Reason in Everyday Life.”
Carl Sagan said of Gilovich’s work that it is “most illuminating” in showing “how people systematically err in understanding numbers, in rejecting unpleasant evidence, and in being influenced by the opinions of others.”
During an interview with Barry Ritholtz, Professor Gilovich touched on a lot of eye-opening topics related to human behavior, both market-related and otherwise. One of the themes of the interview explored why the human mind leads people to ignore some fundamental principles of mean reversion.
Data over time will normally regress to the mean or average, yet people tend to remain “anchored” to what happened most recently. Whether it concerns the financial markets, sports, the weather, or everyday life, Gilovich maintains the following:
-
We tend to see more patterns in the world than are there.
-
We too often hold on to beliefs that do not fit the observed data.
-
We give too much credence to evidence that supports our beliefs and too little to data that does not—confirmation bias is the “mother of all biases.”
Gilovich likes to use easily understood examples from the sports world to communicate some of his points. Three quick examples from the interview explore how overlooking mean-reversion theory can impact some common biases:
#1 “The Sports Illustrated Cover Jinx”: Over the years, people have maintained that appearing on the cover of Sports Illustrated (SI) is bad luck for an athlete. In fact, several pro athletes have turned down a cover for that reason. Gilovich points out that to be considered for a cover in the first place, an athlete usually had to have had an extraordinarily strong performance in his or her last season or last event. Simple mean reversion says that the odds are good that the athlete will not perform up to that standard in the next season or next event. So, while the SI effect might have a basis in observed data, it is not a “jinx,” but more likely reversion to the mean.
#2 “Don’t mention a no-hitter in the dugout”: Every baseball player from Little League on is told it is bad luck to mention a no-hitter in progress within earshot of the pitcher throwing the no-hitter. Gilovich says no-hitters, by definition, are an extremely rare occurrence outside the normal range of most games played. Players tend to remember when no-hitters were “lost” due to some loose lips in the dugout, when in fact the vast majority of no-hitters in progress never make it to fruition. “Bad luck” does not play a role either way, but people are selective in their memory.
#3 “Always give the ball to the player with the ‘hot hand’”: Gilovich, cognitive psychologist Amos Tversky, and statistician Robert Vallone wrote a paper in 1985 that debunked the notion that a “hot” player in sports (specifically basketball) is more likely to remain “hot”—put another way, that a player who has made a high percentage of shots in a game will be more likely to hit his or her next shots. Though somewhat controversial, their data supported the notion that “the hot hand fallacy can lead people to form incorrect assumptions regarding random events.”
What is one explanation for why both fans and coaches believe in the “hot hand theory”? People are more likely to remember a player who performed exceptionally (where he or she made, say, 14 out of 18 shots in a game) than they are the player who made five shots in a row and then reverted to the mean of average performance in that same game. Both random patterns might be achieved several times over thousands of games, but only one type is memorable.
In each of these cases, says Gilovich, individuals have preconceived notions that fly in the face of observed data or the explanation of observed data. He likes to summarize this form of confirmation bias in what he calls a “Freudian slip” from a conversation he once had. Many people, he says, operate from the perspective of “I’ll see it when I believe it.”
Mean reversion in the context of market indicators
What does this discussion have to do with the financial market’s behavior? And investment management theory?
Simply that no matter what one’s emotions or biases are saying about a strong trend in the market, it is a pretty sure thing that eventually that trend will see some mean reversion, or even complete reversal.
We can easily see mean reversion over time in the historical charts of many widely followed tools that analyze the equity market.
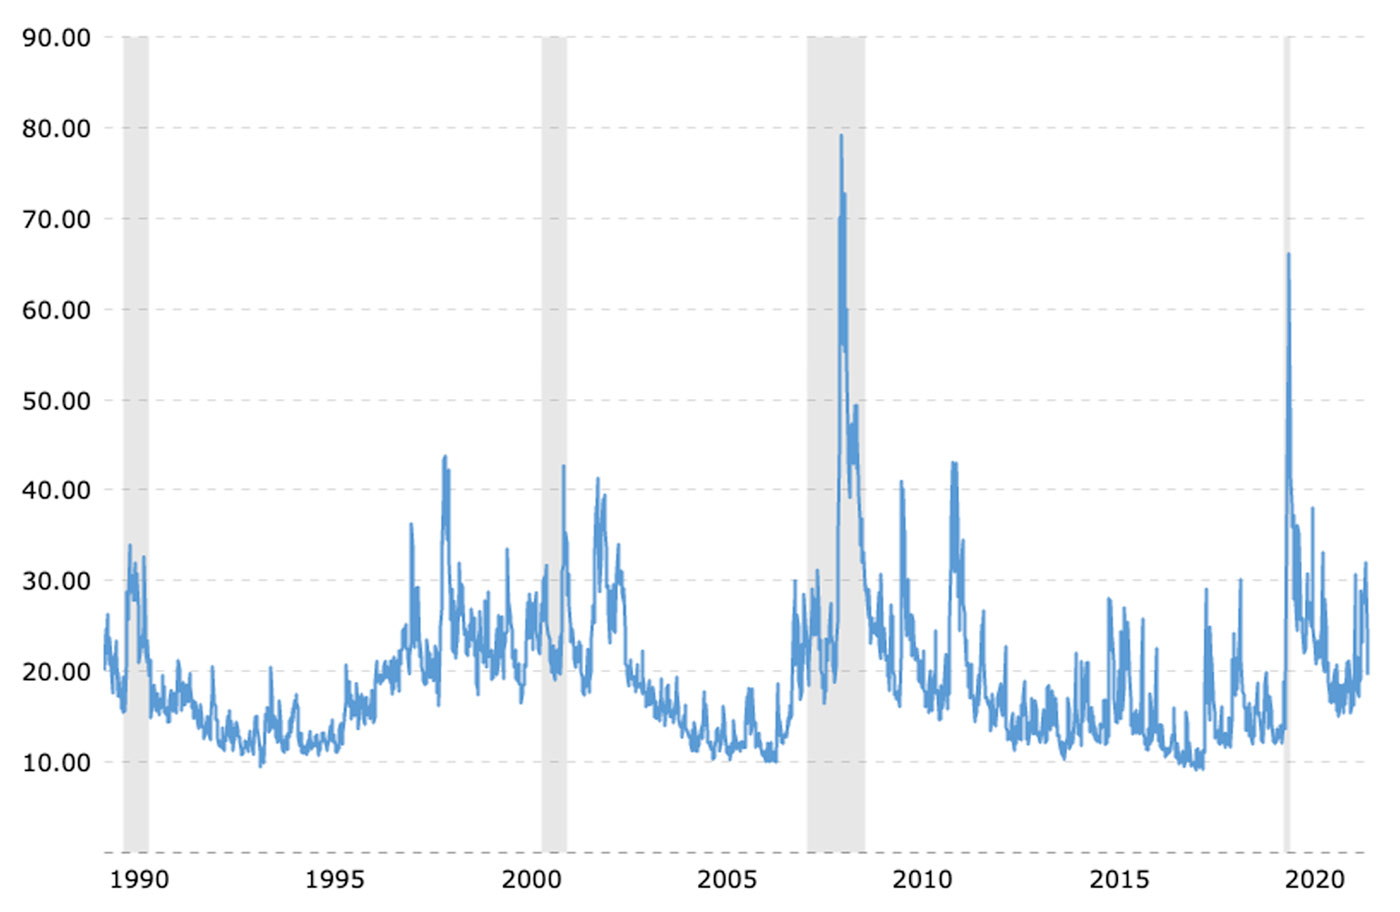
One example is the Cboe Volatility Index (VIX Index), a financial benchmark designed to be a current market estimate of expected volatility of the S&P 500 Index. According to Cboe, the VIX Index “is intended to provide an instantaneous measure of how much the market thinks the S&P 500 Index will fluctuate in the 30 days from the time of each tick of the VIX Index.”
As can be seen in Figure 1, since its inception in the 1990s, the VIX Index has seen many dramatic swings. But over time, the VIX will inevitably revert to a range around its mean, or average, generally between 15 and 20 (a range since it is highly dependent on the time horizon being considered). The median, or midpoint, of all historical values for the VIX, would be several points lower, given the impact of infrequent “outliers” skewing the average.
According to the Corporate Finance Institute (CFI),
“The VIX is intended to be used as an indicator of market uncertainty, as reflected by the level of volatility. The index is forward-looking in that it seeks to predict variability of future market price action. … Historically speaking, a VIX below 20% reflects a healthy and relatively moderate-risk market. However, if the volatility index is extremely low, it may imply a bearish view of the market. A VIX of greater than 20% signifies increasing uncertainty and fear in the market and implies a higher-risk environment.”
FIGURE 1: CBOE VOLATILITY INDEX (VIX) HISTORICAL TREND

Sources: Cboe data, macrotrends.net
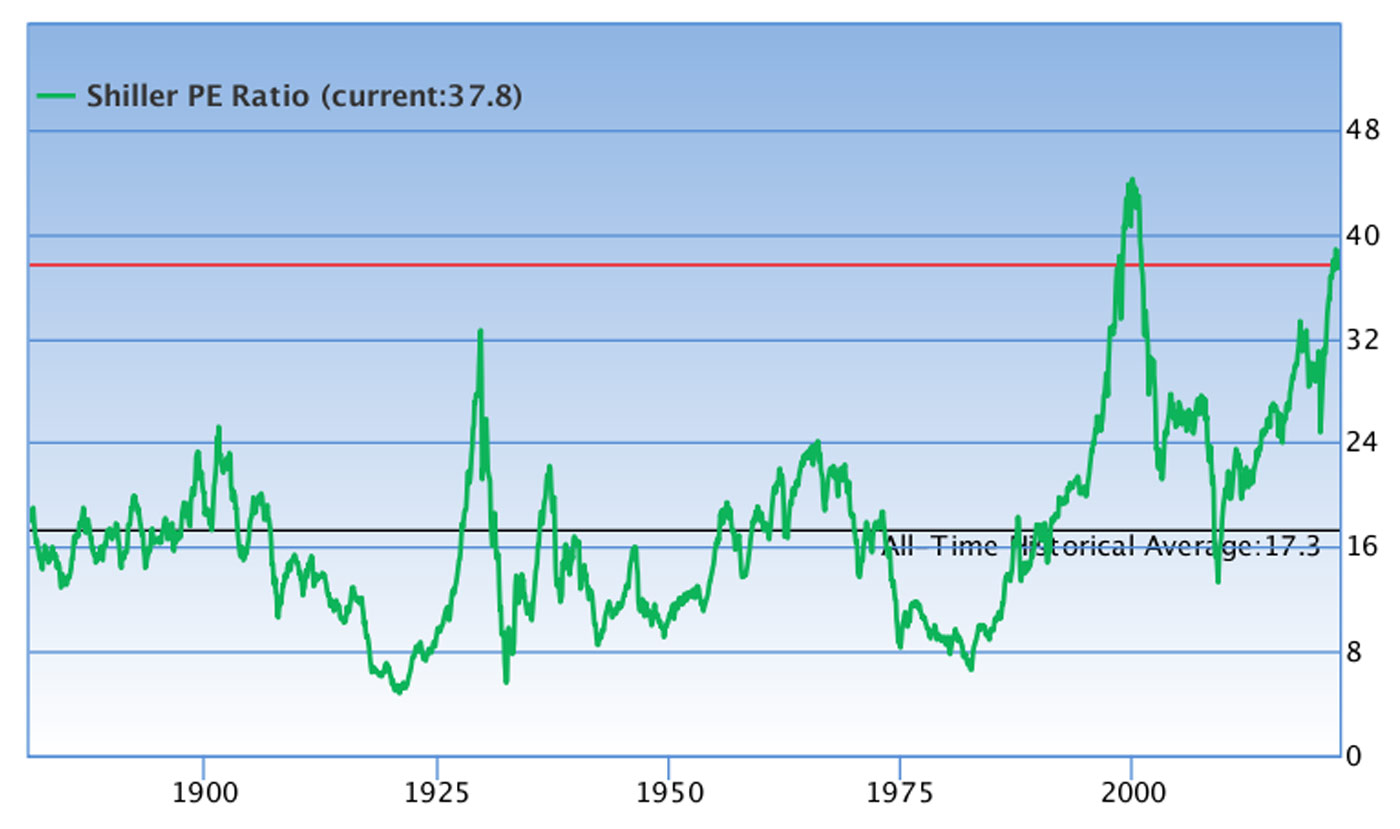
“The Shiller PE is a more reasonable market valuation indicator than the PE ratio because it eliminates fluctuation of the ratio caused by the variation of profit margins during business cycles. … The Shiller PE and the ratio of total market cap over GDP can serve as good guidance for investors in deciding their investment strategies at different market valuations.”
As Figure 2 shows, the Shiller PE measure provides a good view of mean reversion over market history, with many major moves above and below its historical average level.
FIGURE 2: HISTORICAL TREND FOR SHILLER PRICE/EARNINGS RATIO

Source: GuruFocus.com, data as of March 28, 2022
Risk management in preparation for market change
Whether an investor or analyst is looking at the VIX, market valuation models, or a wide range of internal market indicators, the point is that changes in the current market environment—especially near market extremes—are usually somewhere on the horizon. It is just a question of when they will come.
This is one reason that much of the investment management theory featured in our publication supports taking portfolio strategic diversification “to the next level”—with proactive strategies designed to respond in times of market change.
These investment strategies can offer a three-dimensional approach to diversification that aims to increase the odds that a portfolio is correctly positioned to weather market storms—while taking advantage of market opportunities:
-
Diversification by asset class (e.g., stock, bonds, alternatives).
-
Diversification by investment methodology (e.g., momentum, trend following, mean reversion, pattern recognition, and many other approaches).
-
Diversification by time horizon.
Additionally, dynamic strategic diversification can be responsive to different types of market environments, deploying higher portfolio allocations to strategic approaches that tend to perform better in a specific type of environment.
For example, a dynamic, risk-managed approach can seek to do the following:
-
Allocate more to trend-following, high-beta, and leveraged strategies in rising, bullish markets.
-
Allocate more to inverse strategies, leveraged inverse strategies, or strategies with exposure to defensive asset classes during falling, bearish markets.
-
Allocate more to mean-reversion or pattern-recognition strategies during sideways markets, taking advantage of volatility and market swings.
Says one investment manager who has been featured in our publication, “Keeping an eye on all key indicators through our quantitative strategies is what our dynamic, risk-managed investing approach is all about. Historically, it has helped us minimize the downside in bear markets, and that goes a long way toward ‘beating the market’—as we define it.”
A successful financial advisor we have interviewed adds,
“I explain to clients the benefits of active management for at least a part of their portfolio. While actively managed strategies, as I see them, have an important objective of limiting the occurrence and magnitude of negative returns, they can have other key benefits for clients. There are many tactical strategies available—including trend-following, mean reversion, and sector rotation—that can help client portfolios stay in tune with the various phases of business and stock market cycles. In my practice, I stress the importance of having a well-balanced portfolio that can include both offensive and defensive strategies.”
I think this approach is something you can both see and believe in when it comes to sophisticated portfolio management that helps clients achieve their goals-based investment objectives.
The opinions expressed in this article are those of the author and do not necessarily represent the views of Proactive Advisor Magazine. These opinions are presented for educational purposes only.
New this week:
 David Wismer is editor of Proactive Advisor Magazine. Mr. Wismer has deep experience in the communications field and content/editorial development. He has worked across many financial-services categories, including asset management, banking, insurance, financial media, exchange-traded products, and wealth management.
