For the past 66 years, one of the best tools for navigating bear markets and identifying important market bottoms has been the Average Power Rating (APR) Index developed by Lowry Research. The Power Rating is a proprietary indicator composed of various components drawn from the daily trading action of an individual stock. The Power Rating has an absolute range of 0 to 99. The higher the Power Rating, the greater the indicated strength. Conversely, the lower the Power Rating, the greater the indicated weakness.
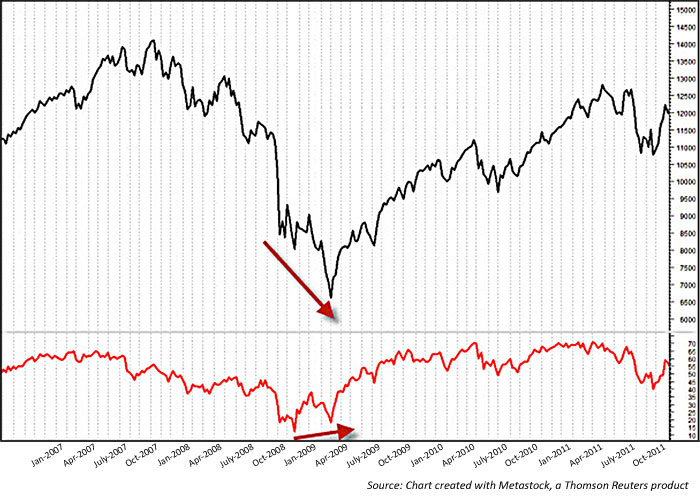
EXHIBIT 1: APR DURING THE 2007-9 BEAR MARKET

For the broad market, Lowry calculates an APR using over 1,000 of the most heavily traded, institutional-type stocks on the NYSE and the NASDAQ. Lowry uses the APR to help gauge the health of the broad market in terms of demand for stocks.
An APR that is trending higher suggests strengthening demand for equities, which reflects a healthy broad-market condition. A contracting APR, on the other hand, suggests diminishing demand for stocks and a weakening broad-market condition. A thorough examination of the APR at major market bottoms dating back more than 40 years shows that major market bottoms occur with either a stabilization or improvement in the APR. This phenomenon is illustrated in Exhibit 1, which shows the March 2009 bear-market bottom.
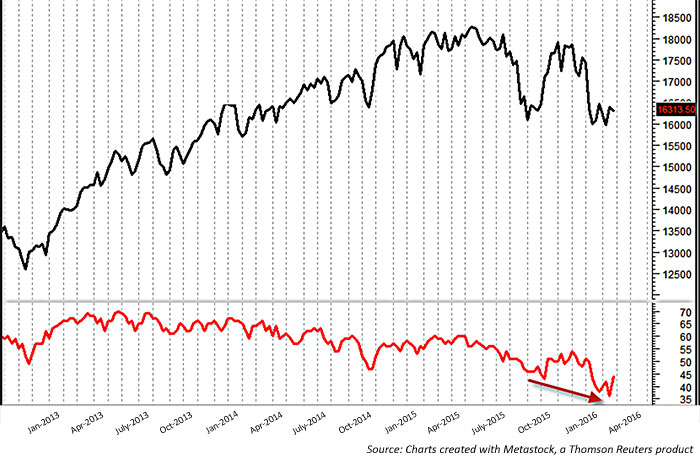
In the current market environment, stabilization in the APR has yet to develop, as illustrated in Exhibit 2. Specifically, at the February 2016 market low, the APR declined to a new reaction low of 36, indicating ongoing weak demand for stocks, rather than the improving demand that tends to develop at major market bottoms.
EXHIBIT 2: APR IN THE CURRENT MARKET ENVIORNMENT

We compare the price action of the major price indexes with that of the APR, along with other factors, such as the actions of Lowry’s Buying Power and Selling Pressure Indexes, the development of a combination of exhausted selling/strong buying, and a contraction in new 52-week lows.
This can offer investors a timely signal as to when to begin aggressively buying stocks in anticipation of an imminent bull market. At the present time, new equity purchases carry a high degree of risk, as any upside price action is expected to represent a temporary respite in a bear market that has more room to run in the months ahead.
 Tracy L. Knudsen, CMT, is senior vice president of market research at Lowry Research Corp. She has been a market technician for 20 years and produces analysis of both domestic and international equity markets. A member of the Market Technicians Association (MTA) since 1994, Ms. Knudsen has also served on the board of the American Association of Professional Technical Analysts (AAPTA). She is co-author of “Mastering Market Timing: Using the Works of L.M. Lowry and R.D. Wyckoff to Identify Key Market Turning Points,” published July 2011. lowryresearch.com
