
A case for active tactical investing

Lessons from behavioral economics and fractal mathematics theory help explain why tactical investment strategies can be beneficial in portfolio construction.
Editor’s note: Dennis Yamasaki has an extensive educational background in quantitative methods, information systems, and statistics, and was a systems and network engineer during his first career. In the following article, he takes a look at both the behavioral arguments for risk-managed strategies and a unique mathematical perspective on active tactical investing.
During the past 15 years, passive investors have been hit hard with two major market events. We can all recall the carnage of the dot-com crash (2001–2), which significantly reduced retirement portfolio values. Then, the 2008 recession impacted investors, as banking failures wreaked havoc on the stock market. News headlines talked about “401(k)s becoming 201(k)s.” Throughout both crises, individuals and families were distraught over the devastation of their retirement nest eggs and their inability to retire as planned. Many would-be retirees had to return to the workforce, not having enough money to afford a comfortable lifestyle.
During good times and bad in the markets, investors are often told to buy low-cost mutual funds or ETFs that track the S&P 500 and hold them “forever.” Warren Buffet comes to mind when I hear this—he is frequently quoted in the media as the investment guru of our lifetime and one who supports indexed investing (though his own firm might be viewed as an astute “market timer”). But does a passive investment philosophy really do the most good for the average or inexperienced investor?
‘Buy and hope’ is not enough
In my practice, I place a great deal of emphasis on client education. Of course, I customize my education efforts to fit the knowledge level of the client I am speaking with. But no matter how sophisticated the client, it is always amazing how short memories can be. This is not surprising. Behavioral economics tells us how vulnerable individual investors are to a “herd mentality” and “recency bias.” In other words, when we are in an extended bull market for equities, far too many investors have to be “re-educated” about the message of risk management.
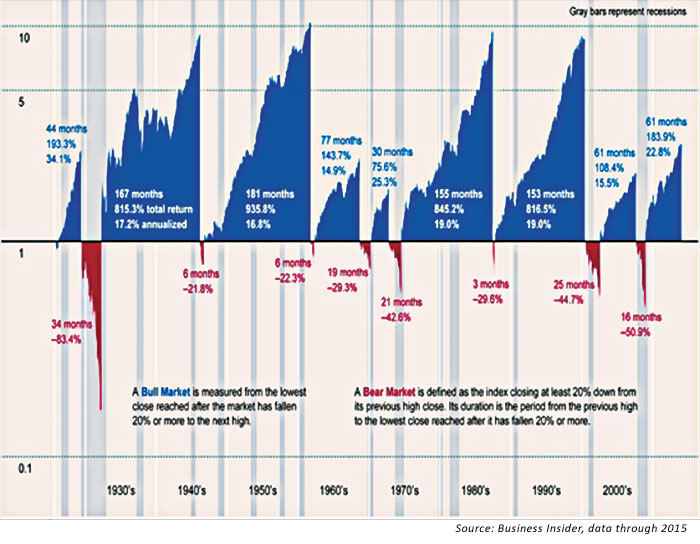
Market cycles are fairly consistent throughout history. One can see that bear markets and recessions come approximately every six to eight years, with somewhat predictable regularity. Figure 1 illustrates this point, and I find it to be a very helpful tool with clients. The gray bars represent recessions, and the blue peaks are bull markets. Note that although market downturns tend not to last nearly as long as bull markets, they can come on very swiftly and can have a devastating impact on passive portfolios.
FIGURE 1: BULL AND BEAR MARKETS DURING THE PAST 10 DECADES
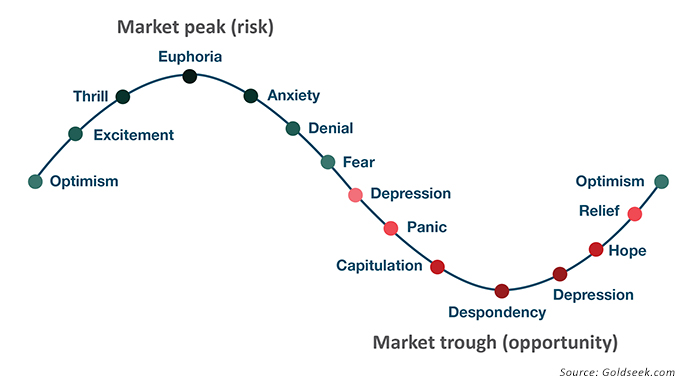
When emotions take over during a market downturn, people often panic and sell near the bottom. And when markets are rising, people jump on the bandwagon and invest close to the times when the markets are peaking (see Figure 2). So individual investors suffer from buying high and selling low—exactly the opposite of what investors are seeking to do. The well-known DALBAR research studies reinforce how poorly individual investors are at “timing the market.” Buy-and-hold strategies effectively become “buy and hope” for many investors, with serious negative sequence-of-returns consequences, especially for those near or in retirement.
FIGURE 2: INVESTOR SENTIMENT DURING MARKET CYCLES
My investment philosophy for clients
I am passionate about helping clients to protect what they have, both from an insurance and investment perspective. I am equally passionate about helping them to grow their wealth. From reviewing the actual portfolio performance of many new clients, I see clearly how an actively managed and more conservative approach could have had a tremendous impact on the bottom line of their portfolios. That starts with avoiding the big losses concentrated around a large market decline—the power of not losing money is often more powerful than only focusing on investment gains.
I started my financial career on the insurance side of the business and a few years later moved on to more holistic planning and investment management. I was then exposed to active money management and have become a true believer in that philosophy. We know all about economic and market cycles from history. There will be boom and bust cycles, recessions, and bear markets. Active and tactical managers cannot predict with 100% certainty when these will start and end. But they certainly can improve the investment odds and probabilities for my clients with their focus on risk-adjusted returns.
That is the essential message I deliver to clients, and, for just about everyone, it makes perfect logical sense. I ask clients, “If you are able to minimize the downward cycles in your investment portfolio, won’t you feel more secure and confident in taking on your retirement years?” The answer is uniformly “yes.”
Tactical investment management
Tactically managed strategies are one of the many tools active investment managers have in their arsenals for client portfolios. With tactical management, professional money managers are watching many data points as they attempt to reap the gains in upward-trending markets and avoid the downward trends of the market.
Their goals can vary widely with the types of tactical strategies employed. But many of these strategies, in the final analysis, simply are to “buy relatively low” and “sell relatively high.” There are numerous data points that their sophisticated models and algorithms can utilize, including (a) market-based factors such as resistance levels, moving averages, price trends, mean-reversion patterns, and volume trends; and (b) fundamental economic macro factors.
I have personally studied the historical performance of several tactical money managers. Most of them have delivered competitive returns over longer time periods (my research primarily covers the period from 2000 to 2015). Some are decent, some are good, and a couple of them are quite good.
So what makes one manager better than another? It is their ability (or their model’s ability) to identify and react appropriately to upward and downward trends. How well do their models react in trendless markets, characterized by “whipsaw” in the indexes? Do their models perform better in certain market environments? How well do they handle markets when they are in a downtrend?
Some managers are looking for definite longer-term trends and take shorter-term market volatility in stride. Some are looking for intermediate trends and trade approximately once or twice a month. One active manager who has performed very well trades more often and can employ inverse strategies to attempt to make money on downturns. Some managers are far more aggressive than others, seeking market-beating returns when conditions are right, while others look to “smooth out the volatility ride” for client portfolios.
There is no right or wrong answer, and many different tactical styles can be successful. It is critical for the financial advisor to understand the goals and objectives of a money manager’s tactical strategy, how it has performed against those objectives, what types of environments it does well in and when it might tend to struggle, and how appropriate it may be for any individual client portfolio and client risk profile.
The search for the ultimate tactical strategy: Can fractal math help?
As someone who could accurately be called a “math geek,” I have long been intrigued by my finding that shorter-term tactical strategies can perform very well in the markets. I set out to answer this question: Can fractal math and geometry inform an investment strategy that can achieve superior investment returns?
There are many ways to describe and define geometric fractals. Generally, a fractal is a geometric shape that patterns to progressively smaller geometric shapes that represent the larger shape. As one keeps adding smaller and smaller geometric shapes to the original shape, the measurement becomes infinitesimal—even though it seems that the fractal shape has a finite measurement. See the example of the triangle fractal below. Keep adding another smaller triangle to each side of every triangle.
FIGURE 3: A CONCEPTUAL REPRESENTATION OF FRACTAL SHAPES

In conducting my research, I came across a video that showed the fractal example of measuring the coastline of an island like Britain. As I was watching this video, a light bulb went on.
Is it possible that fractals partially explain why the active manager who trades more often has generally been achieving better investment returns than active managers trading less often? Maybe.
Using a large measuring stick—say, 100 miles long—to measure the coastline of the large island of Britain produces a certain finite measurement. Using a smaller measuring stick—say, 1 mile long—allows the measurer to capture more fluctuations in the coastline, such as curves, inlets, and bays. Further, using a yard stick, the measurer would capture many more fluctuations, and the coastline measurement would be much longer. The smaller the measuring stick, the larger the coastline measurement.
Figure 4 captures the same concept. Notice how the measured length of Britain’s coastline increases in kilometers when the measuring stick gets smaller. There is a difference of approximately 1,000 km in total length of Britain’s coastline between the “large” measuring stick (200 km) versus the “small” measuring stick (50 km).
FIGURE 4: MEASURING THE LENGTH OF BRITAIN USING DIFFERENT MEASURING STICKS

How do fractals relate to measuring investment returns?
In a buy-and-hold strategy, the measuring stick is the investment starting point and the investment ending point (or present date). This is one line with a slope, and the gains are measured on a y-axis in dollars and on an x-axis in time. All of the ups and downs of the markets are ignored in the measurement.
In a tactically managed strategy, the manager is looking for trends. There are measuring sticks that are smaller than those found in a buy-and-hold strategy. They measure upward trends captured by an investment buy point to the investment sell point. In an ideal tactical defensive strategy that waits for a falling market to bottom out and start going back up, the “negative” measuring sticks are essentially thrown away. Investments effectively take a pause while the markets are falling. Tactical managers are going to cash positions while the market is falling. The results come by adding the gains on the y-axis ($) of each of the rising investment periods and ignoring the downward segments where avoided. They may be stacked upward over time (x-axis).
Theoretically, the smaller the increments of measured trends, the higher the investment returns. Those that master day trading could be huge winners if they are exceptional at determining the very small trends during each day the markets are open and executing timely trades. Similar to the measurement of the coast of Britain previously described, the smaller the measuring stick, the larger the coastline (trading opportunity). (In actual practice, day trading is extremely difficult and few people master the recognition of intraday trends.)
In a tactically managed strategy, where the manager is seeking weekly or biweekly trends, it will capture more upswings and “throw away” more negative swings in the market than those looking for larger trends. One might then add to this the capabilities of a manager who is willing to attempt to make money on downward swings with “short” positions or funds with lower levels of market correlation, such as a gold-related fund. This can allow positive returns to be made during downward market swings, instead of just “throwing away” the negative measurements of the stock market. Adding to your investment gains while the market is going down is like adding more measuring sticks to build your portfolio value.
But, does the theory work?
To highlight my point, I examined three different investment strategies from 2000–15.
Scenario 1: Buy and hold from 2000–15. The S&P 500 gained close to 30% in 16 years, which would turn a $100,000 investment into $128,000. No trades.
Scenario 2: Intermediate-trend tactical management. Based on the investment results of the managers I examined, the “best” trend-following strategy with an intermediate time frame executed 5 to 16 trades per year and almost tripled portfolio value, which would turn a $100,000 investment into $293,000. Volatility was lower than the buy-and-hold strategy, deep drawdowns were avoided, and investment returns were in a tighter range.
Scenario 3: A short-term tactical manager who tends to trade weekly or biweekly turned an initial investment of $100,000 into $727,000, doubling almost every five years. (Note: actual results from 2002–15 and modelled results from 2000–2). Many more “measuring sticks” (much shorter time frames) were used, and volatility was greatly reduced. While gains and losses were smaller, they were far more frequent, and drawdowns were very low.
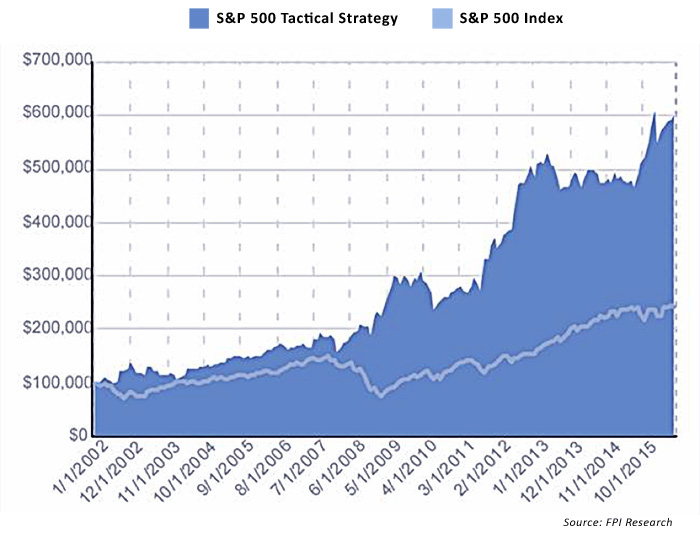
To illustrate the potential compounded returns of a tactical investing approach, Figure 5 provides a look at a backtested S&P 500 tactical strategy versus the S&P 500 Index (2002–16).
FIGURE 5: COMPARATIVE GROWTH OF $100,000, 2002–16
As we all know, there is no perfect investment strategy. These results came during periods of unprecedented market volatility, two major global economic downturns, and then one of the longest bull markets in history. There is certainly no guarantee that these results can be replicated in the next five, 10, or 20 years of the markets. Would I commit 100% of my personal portfolio or a client’s portfolio to the strategy represented by Scenario 3? No. But I certainly would consider this type of strategy as a potential component of a well-balanced, actively managed, and diversified portfolio.
When you invest using any strategy, there is potential for investment results to vary from historical performance and the very real possibility of investment loss. My role as a financial advisor is to construct portfolios that have the best probabilities of achieving an individual client’s objectives. My observation and experience dictates that these portfolios will probably best utilize multiple strategies, multiple asset classes, and, likely, multiple managers.
It is interesting to me, nonetheless, to find that the fascinating worlds of fractal math and fractal geometry can perhaps help explain why shorter-term tactical strategies can be successful. The idea of capturing shorter time frames using “smaller measuring sticks” is informed by fractal theory. It is quite remarkable that it not only “works” in geometric theory and in many shapes found in nature, but can work in investment theory as well.

Dennis Yamasaki is the president and owner of Affirmative Financial Services, a registered investment advisory firm located in the metro Seattle area. Mr. Yamasaki has over a dozen years of experience in the financial-services industry, with specific expertise in real-estate financing, retirement and investment planning, and addressing clients’ life- and health-insurance needs.