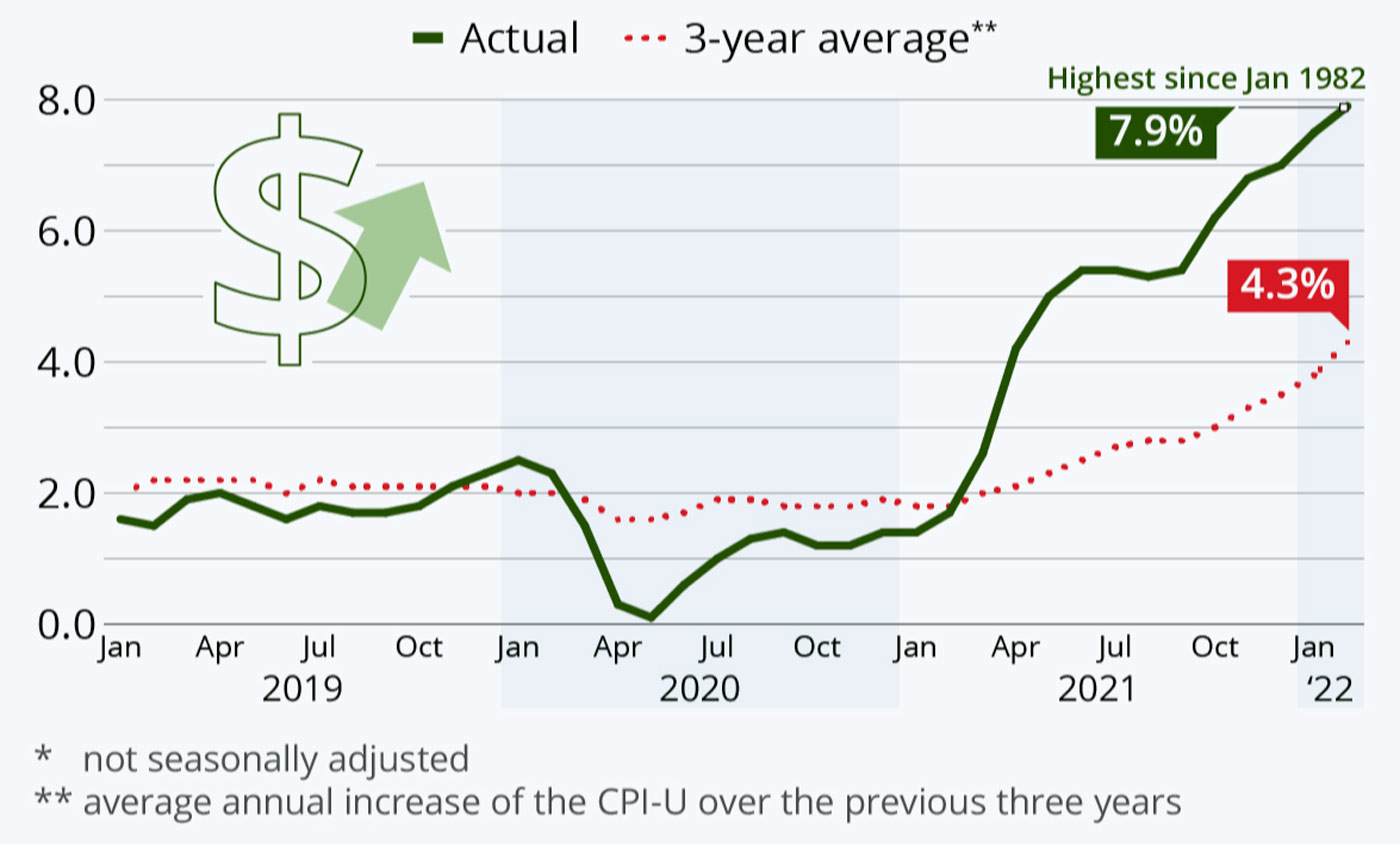
An analysis from Barron’s this week points out that the inflationary spiral for everyday purchases is “playing out across America at a speed that is catching many households off-guard and at a magnitude that official metrics aren’t portraying.”
Barron’s notes further,
“The 7.9% surge in total consumer prices last month from a year earlier marked a new 40-year high at a time when inflation-adjusted household incomes are falling at the fastest pace since the government began the data series in 1959. But the reality is much worse, and it is probably going to worsen still as the economic effects of Russia’s invasion of Ukraine play out.
“When you strip out everything but essentials—which is the opposite of what economists and policy makers do when they exclude food and energy prices to calculate so-called core inflation—the average change in those basic items rose more than 16% last month from a year earlier. In February from January alone, the month-over-month price change in those basics, including meat, bread, milk, shelter, gas, and utilities, rose 2.2%.
“For context, the Federal Reserve has long targeted a 2% annual inflation rate, which translates to a little less than 0.2% in month-over-month increases. Even then, some consumers say the price increases they are facing are far higher than what’s reflected in the consumer price index, a weighted average of goods and services across the country.”
Data analytics firm Statista adds,
“When inflation spiked in the spring/early summer of 2021, it was largely due to the so-called base effect, reversing the pandemic’s cooling effect on consumer prices a year earlier. At the onset of the pandemic, prices had taken a dive due to a sudden drop in consumer spending and fuel demand before slowly climbing back to their pre-pandemic trajectory over the summer and fall. Due to that initial dip in consumer prices, year-over-year comparisons were always going to be exaggerated for a while, but that is no longer the case. …
“To eliminate the short-term effects of the pandemic, we calculated the average annual inflation rate over a moving three-year period, yielding a curve that fluctuated around 2 percent for a long time, until it took off last summer. In February, the three-year average inflation rate climbed to 4.3 percent, clearly indicating that the latest spike in consumer prices is more than just a statistical blip and should be taken seriously.”
FIGURE 1: YEAR-OVER-YEAR CHANGE IN CONSUMER PRICE INDEX FOR
U.S URBAN CONSUMERS

Sources: Bureau of Labor Statistics, Statista
Consumer sentiment falls on inflation concerns
According to preliminary results from the University of Michigan’s March 2022 survey, inflation concerns led to a continued fall in consumer sentiment.
TABLE 1: UNIVERSITY OF MICHIGAN PRELIMINARY MARCH 2022 CONSUMER SENTIMENT

Source: University of Michigan
Surveys of Consumers chief economist, Richard Curtin, commented on the data as follows:
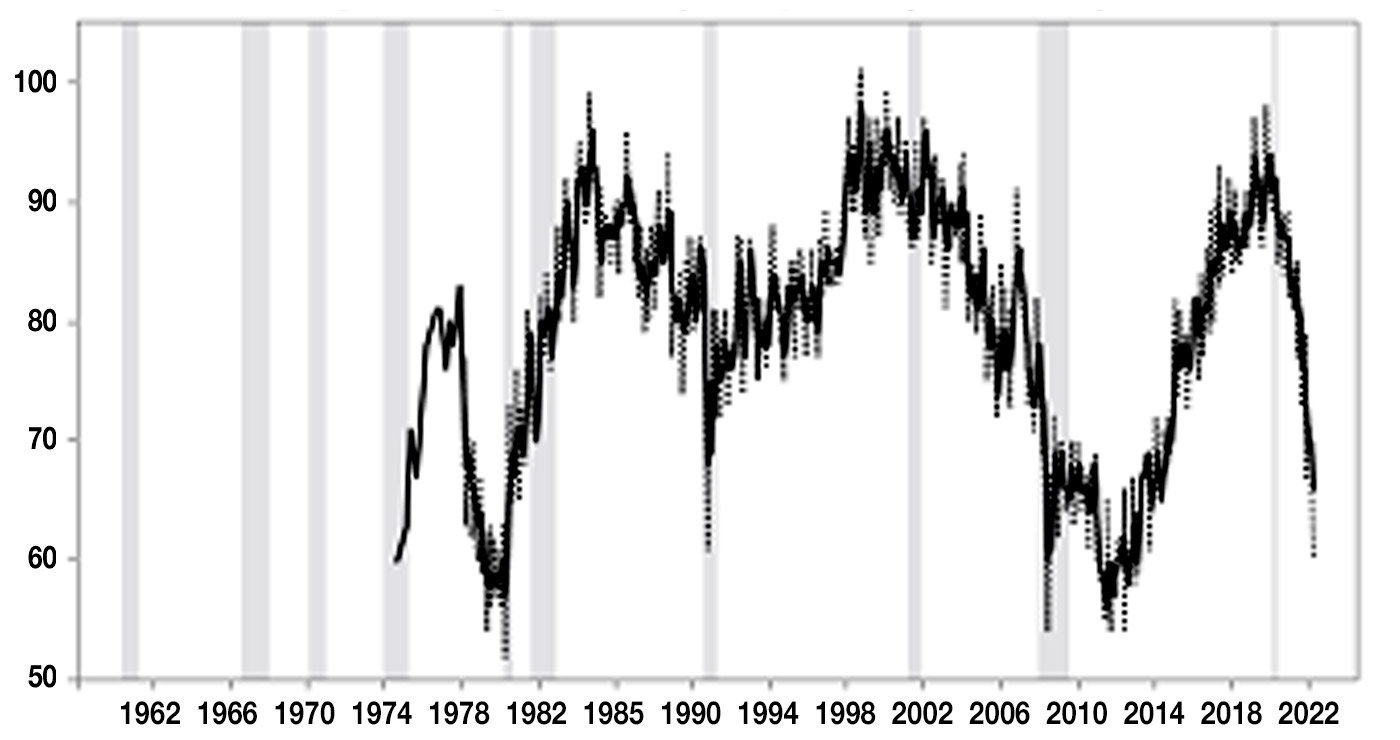
“Consumer Sentiment continued to decline due to falling inflation-adjusted incomes, recently accelerated by rising fuel prices as a result of the Russian invasion of Ukraine. The year-ahead expected inflation rate rose to its highest level since 1981, and expected gas prices posted their largest monthly upward surge in decades. Personal finances were expected to worsen in the year ahead by the largest proportion since the surveys started in the mid-1940s. Consumers held very negative prospects for the economy, with the sole exception of the job market. Consumers were slightly more likely to anticipate declines rather than increases in the national unemployment rate. This underlying strength in jobs comes at the cost of pushing inflation even higher due to unrelenting pressures on aggregate demand and supply lines. The persistent strength in demand was a critical factor that shaped the last inflationary age from 1965 to 1982, with stagflation peaking only near its end. Current expectations are consistent with heightened pressures on wages to meet the continued growth in demand. …”
FIGURE 2: EXPECTED CHANGE IN REAL INCOMES DURING THE NEXT YEAR

Note: Trend in difference between income and price expectations (income up-prices up +100; monthly and three-month moving average).
Source: University of Michigan
New this week:
