With more than 99% of S&P 500 companies having reported, the Q2 earnings season has wrapped up in an impressive fashion.
Key metrics for Q2 2021, according to FactSet, include the following:
- “Earnings Scorecard: For Q2 2021 (with more than 99% of S&P 500 companies reporting actual results), 87% of S&P 500 companies have reported a positive EPS surprise and 87% of S&P 500 companies have reported a positive revenue surprise. These are the highest percentages of S&P 500 companies reporting positive EPS and positive revenue surprises since FactSet began tracking this metric in 2008.
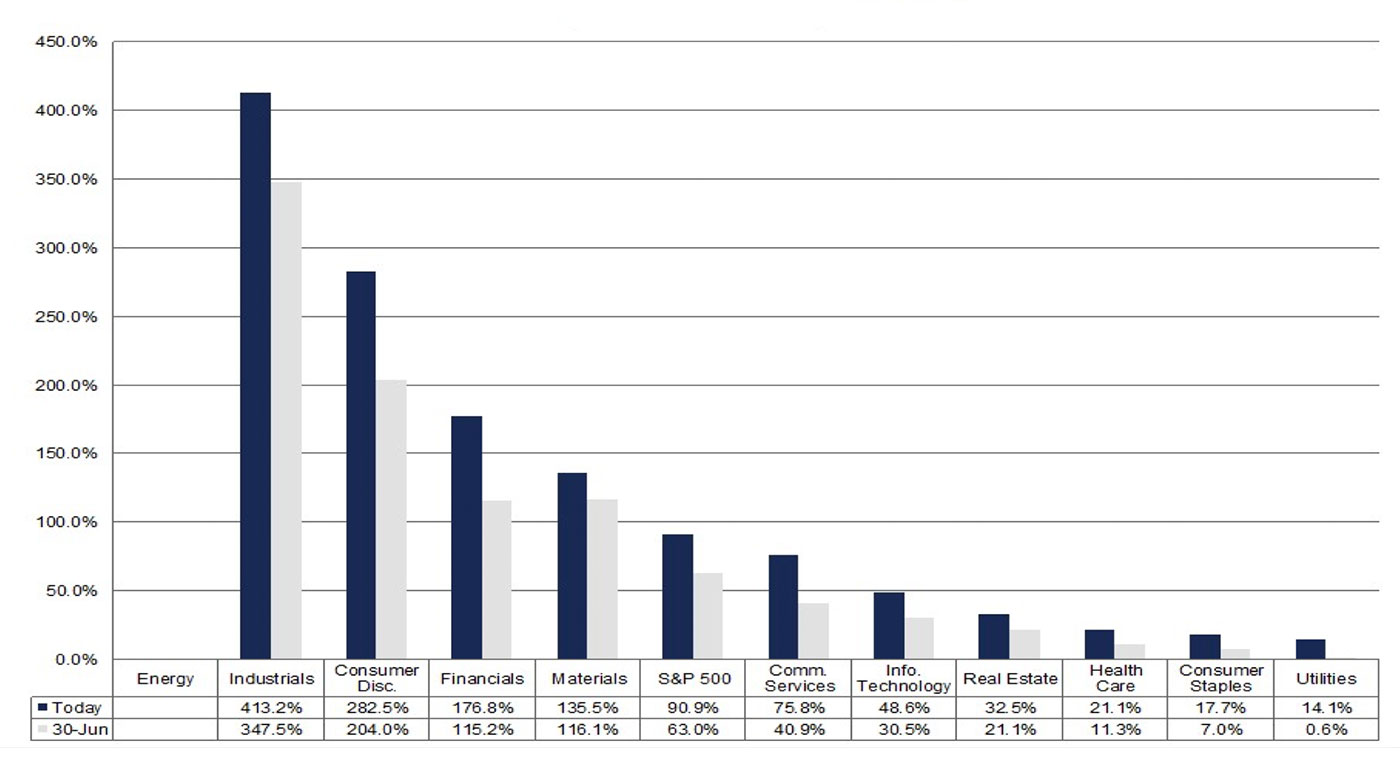
- “Earnings Growth: For Q2 2021, the blended earnings growth rate for the S&P 500 is 90.9%. This is the highest year-over-year earnings growth rate reported by the index since Q4 2009 (109.1%).
- “Earnings Revisions: On June 30, the estimated earnings growth rate for Q2 2021 was 63.0%. Ten sectors have higher earnings growth rates today (compared to June 30) due to upward revisions to EPS estimates and positive EPS surprises.
- “Earnings Guidance: For Q3 2021, 46 S&P 500 companies have issued negative EPS guidance and 55 S&P 500 companies have issued positive EPS guidance.
- “Valuation: The forward 12-month P/E ratio for the S&P 500 is 21.3. This P/E ratio is above the 5-year average (18.2) and above the 10-year average (16.3).”

Note: The Energy sector is coming off a loss in Q2 2020, preventing a mathematical projection for earnings growth.
Source: FactSet
While earnings for Q2 2021 were in many ways the best in over a decade, some recent data suggests a weakening in consumer sentiment and activity. Many analysts attribute this to the spread of the COVID-19 delta variant, the impact of stronger inflation, and the time elapsed since the federal government’s direct stimulus checks in the spring.
Consumer confidence/sentiment
According to The Associated Press,
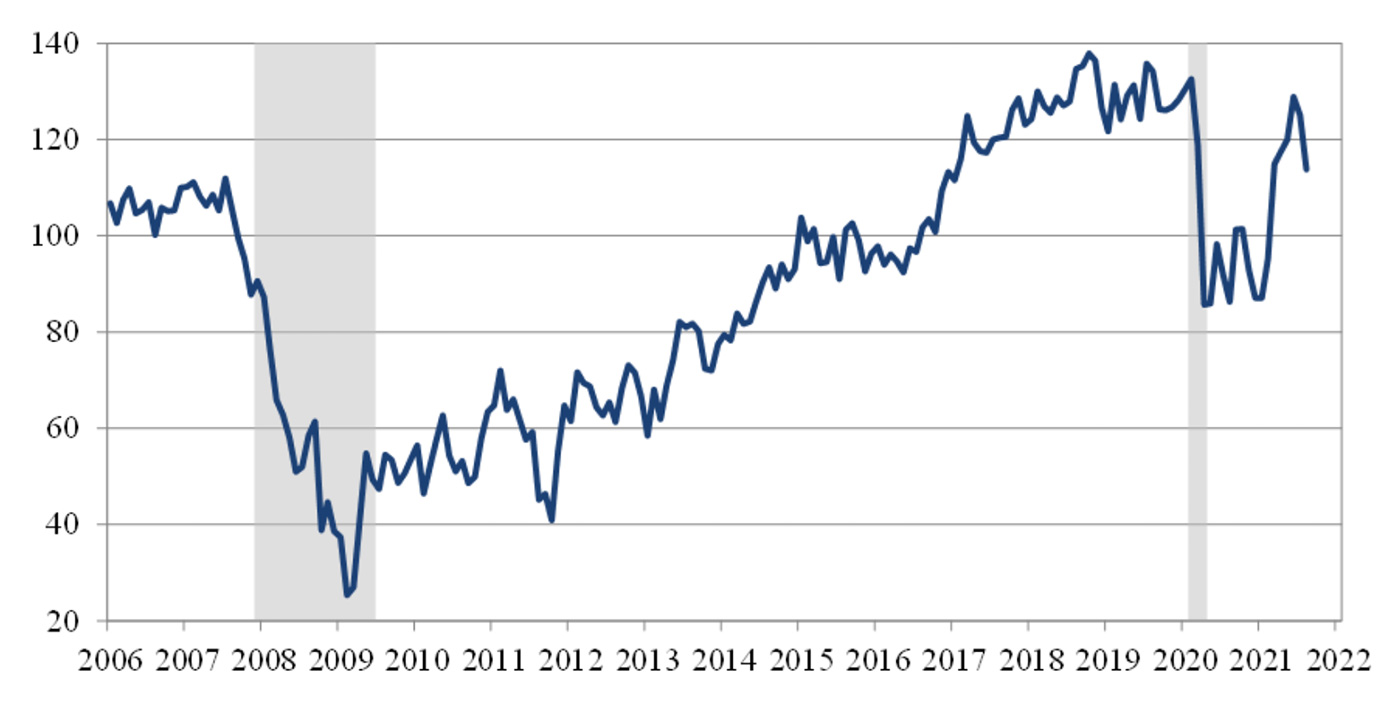
“The Conference Board reported Tuesday that its consumer confidence index dropped to a reading of 113.8 in August, down from a revised 125.1 in July. It was the lowest level for the index since a reading of 95.2 in February. …
“The Conference Board said that concerns about the resurgence in COVID cases as well as worries about rising gas and food prices had contributed to the drop.
“With the August decline, the overall index is 19 points below its pre-pandemic level. The drop in August reflected a weakening in both the current conditions and expectations components of the index.”
The slippage in consumer confidence in this study was fairly consistent with a weakening in recent sentiment data provided by the University of Michigan’s Surveys of Consumers. That data, however, was “the lowest sentiment reading since December 2011,” according to MarketWatch.

Source: The Conference Board
Consumer spending
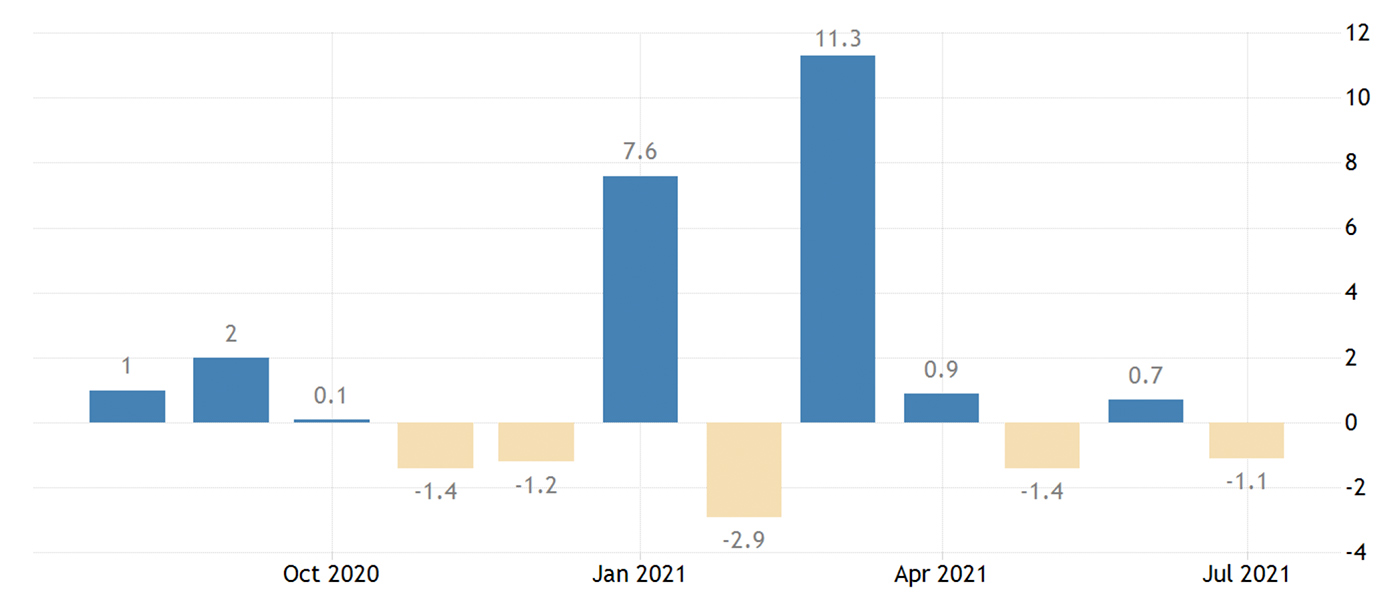
On Aug. 17, the U.S. Census Bureau reported a month-over-month decline in retail sales for July. However, this was still well above retail sales for the same period in 2020, with an absolute increase of 15.8%.
Trading Economics noted,
“US retail trade fell 1.1 percent from a month earlier in July 2021, following a revised 0.7 percent growth in June and compared with market consensus of a 0.3 percent drop, led by a decline in auto purchases and as a resurgence in COVID-19 cases hit consumer demand. The latest data also reflected the recent shift of spending from goods to services following the reopening of the economy.”

Source: Trading Economics, U.S. Census Bureau
Employment data
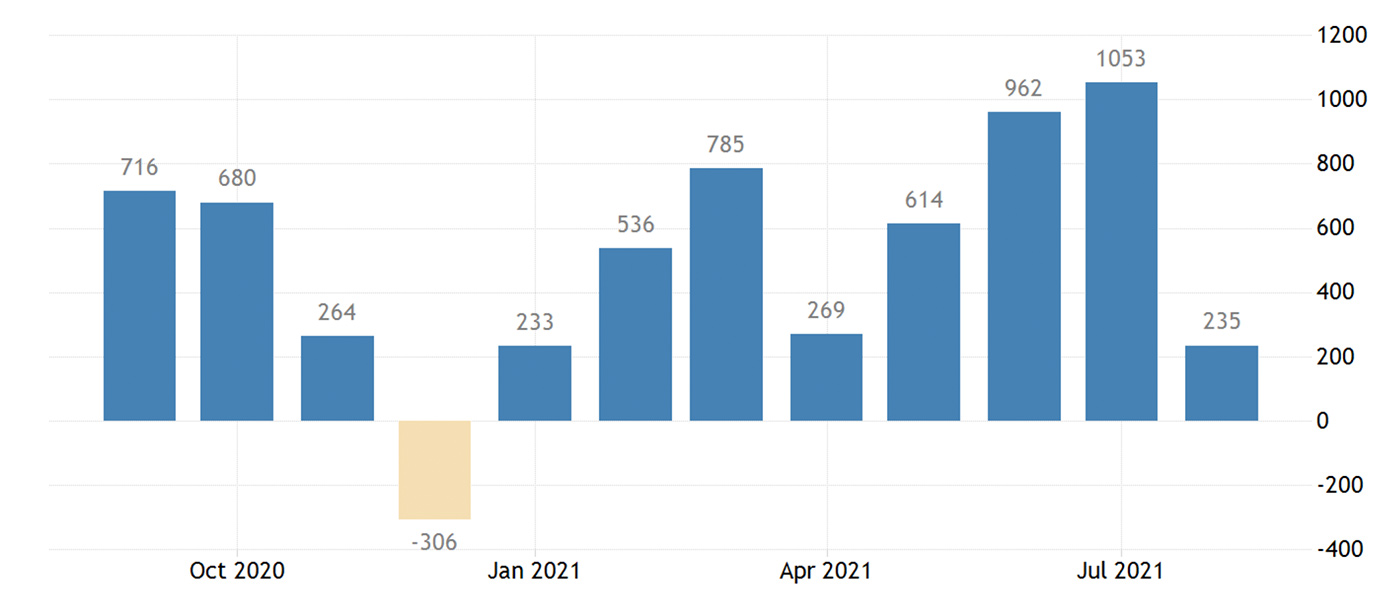
The August employment data from the U.S. Bureau of Labor Statistics was a huge miss, with the economy adding just 235,000 new positions. This was less than a third of most analyst expectations, which were for approximately 720,000 new hires, according to CNBC.
The unemployment rate did drop “to 5.2% from 5.4%, in line with estimates,” says CNBC.
Barron’s, however, noted that the report wasn’t all negative, at least in terms of overall 2021 jobs growth:
“The 0.6% month-over-month increase in average hourly earnings pointed to continued inflation, while the upward revisions to June and July employment numbers, which went to 976,000 and 1.1 million, respectively, suggested that perhaps the figures weren’t quite as weak as they looked. That just about no jobs were created in the leisure and hospitality industry indicated that the Covid-19 Delta variant might have been a bit of a problem.”

Source: Trading Economics, U.S. Bureau of Labor Statistics
‘Reopening’ consumer activity declines
According to The Washington Post, the impact of the delta variant spread has had multiple impacts on consumer activity:
“This gloom and ongoing fear of the virus are causing people to pull back on some spending. Restaurant reservations, hotel bookings and airline passengers all declined in August as people grew more cautious. Companies such as Amazon, Google, Apple and Facebook pushed back their return-to-the-office dates for white-collar workers, another blow to the range of businesses that support office work, including local restaurants.
“In a telling sign, 5.6 million people said they were ‘unable to work’ because their employer closed or lost business because of the pandemic, Labor Department data shows. That was an increase of about 400,000 people compared with July, a clear sign of the delta variant’s toll on the workforce in the last few weeks.”
