
So far this year, an estimated $1.2-plus trillion in corporate buybacks are scheduled, and this number may increase. Buybacks affect stock prices in several ways. Therefore, it is important for investors to understand how this might alter their return on investment and, possibly, their stock dividends. In addition, it is also important to understand what will happen to overall stock prices when the buybacks end.
The intent of corporate buybacks is to support or move prices upward and sustain the price value, even while the buy-side institutions using dark pools have been in a sell mode most of this year. In mid-January 2018, the bloated inventory for exchange-traded fund (ETF) developers, especially for the S&P 500 ETF SPY, was a huge risk. Primary derivatives developers such as BlackRock began a systematic selling of their inventory in February. Their goal was to lower their units of ETFs for sale by selling stock held in the trust fund for a particular ETF. The heaviest selling occurred in the S&P 500 Index ETFs. The S&P 500 is the most popular index in the world, and there are numerous ETFs based on it.
Demand for the SPY had accelerated through the end of 2017. However, demand peaked in January 2018, and its price began to decline. The developers were at risk of holding too much inventory of units. There was rumor of the risk of a run on ETFs due to concerns about the political and international stress in January 2018. A run on S&P 500 ETFs where investors suddenly sold ETFs could cause developers to experience some financial distress.
Hence, the selling of inventory began in February, with a reduction in the number of units of ETFs for certain developers. The indicators that track large-lot activity shifted from showing buying to a slow and steady selling mode for the post-January period of this year.
Meanwhile, stock buybacks began in 2018, soon after corporations were granted the tax cuts signed into law by the current administration in December 2017. Companies secured approval from the Securities and Exchange Commission to begin those buybacks. As rotation from the buy-side institutions using dark pools continued, the corporate buybacks supported and even moved the S&P 500 upward, giving investors a false sense of security. However, most of the S&P 500 stocks are not in uptrends. Most remain in trading ranges, and the 15% of stocks on that index that are trending up are doing so primarily due to corporate buybacks (in my opinion). This gives the illusion of strength in the S&P 500 Index, even while the buy-side institutions continue their selling mode.
Apple (stock ticker: AAPL) has set the record thus far for the largest number of buybacks in the history of any corporation. As one of the heaviest weighted of the component stocks of the S&P 500 Index, it has helped the Index maintain the illusion of an uptrend. Volume and large-lot indicators reveal the weakness within that trend for the S&P 500 Index chart.
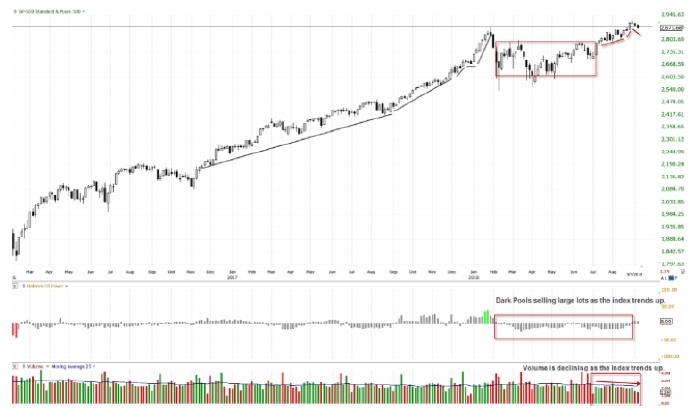
Figure 1 presents a three-day chart view, which is used to pattern out daily price and volatility on the S&P 500 Index. The “balance of power” indicator, which is a large-lot indicator, shows that during most of 2018 there was large-lot selling against the buybacks of the corporations.
FIGURE 1: S&P 500 INDEX WITH BALANCE OF POWER INDICATOR AND VOLUME TREND
Click Image to Enlarge
Source: Technitrader.com. TC2000 chart courtesy of Worden Bros.
The S&P 500 Index has been moving up, but volume is declining. This is a negative divergence. The balance of power large-lot indicator shows slow, steady selling as the Index trends up, which is also a negative divergence.
Summary
The chart analysis interpretation is that the S&P 500 Index is not moving up due to normal supply and demand. It is moving up primarily on the support of the buybacks of large corporations. In 2019, these buybacks will taper off. Stock prices will then no longer be artificially supported by the corporations, and that will impact investment returns and dividends.
If there are fewer new investors, and if the fundamentals of numerous companies (especially for revenues) weaken, then stock values will begin to decline. Corporate revenues have been projected to achieve a slower growth rate in 2019. The buybacks have created a temporary and artificial buoyancy for the market, that, when stopped, puts weaker companies at greater risk of a bear cycle of a business sector or specific industry—or possibly even a full-blown bear market cycle for equities.
The opinions expressed in this article are those of the author and do not necessarily represent the views of Proactive Advisor Magazine. These opinions are presented for educational purposes only.
 Martha Stokes, CMT, is the co-founder and CEO of TechniTrader and a former buy-side technical analyst. Since 1998, she has developed over 40 TechniTrader stock and option courses. She specializes in relational analysis for stocks and options, as well as market condition analysis. An industry speaker and writer, Ms. Stokes is a member of the CMT Association and earned the Chartered Market Technician designation with her thesis, "Cycle Evolution Theory." technitrader.com
Recent Posts:

