The market’s nine consecutive days of declines that ended last Friday were clearly tied to uncertainty over the U.S. presidential election outcome, and, specifically, to the tightening of polls in the late days of the campaign. This Monday’s dramatic market rebound after Sunday’s FBI “announcement” was evidence of the market’s relief. This telegraphed strong approval of the likelihood of the election resulting in a gridlock “status quo” in Washington—an outcome that clearly did not come to pass.
However, in the background of the political drama, the “Apple effect” was certainly not helping markets either. Apple stock’s price lost around 9% over roughly the same period as the market decline, contributing significantly to the overall market weakness.
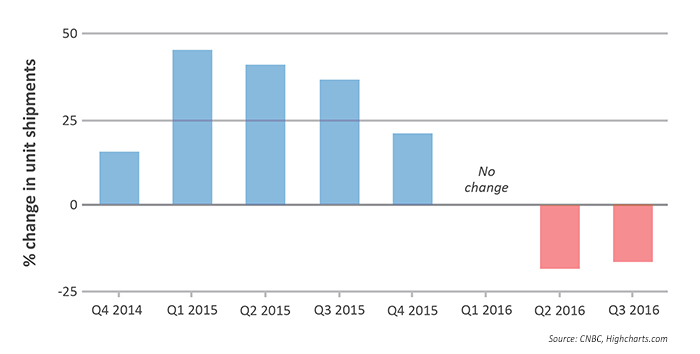
Apple (AAPL) reported earnings on October 25, delivering the news that quarterly revenues and net income declined from the year-ago period. According to CNBC, “the quarterly results marked the third straight quarter where Apple posted a year-over-year revenue decline.”
There were some positive highlights to the report, as Apple reported more iPhone sales than expected during the quarter at 45.5 million units (versus an expected 44.8 million iPhones). Still, says CNBC, “iPhone shipments fell 5 percent, down from 48.04 million a year ago, according to analysts surveyed by StreetAccount.” The question being asked by many analysts is whether or not iPhone sales have peaked.

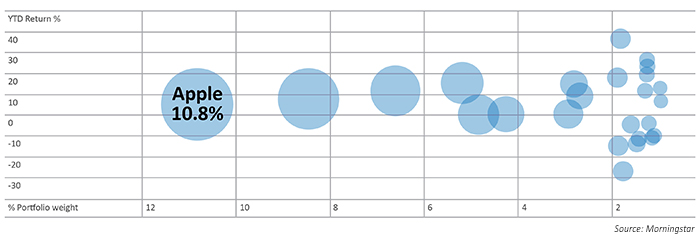
Adding to this debate is the simple fact that Apple’ stock is seemingly omnipresent and dominating in so many indexes, mutual funds, and ETFs—the “Apple effect.” Some question whether investors (and even their advisors) truly understand the amount of Apple stock that is tucked away in all of the elements of an individual investor’s portfolio.
Some simple facts from Bloomberg and other sources show how ubiquitous Apple stock holdings have become in the U.S. equity market:
- With a market capitalization of $586.8 billion (as of 11.7.16), Apple has the largest market cap in the U.S. market, though Alphabet (GOOGL) has had periods of claiming the #1 spot and currently is a close second in market cap at $544.4 billion.
- With the inclusion of Apple in the Dow Jones Industrial Average (DJIA) in 2015, the company is now represented in all three of the major U.S. indexes: S&P 500, NASDAQ Composite, and DJIA. (Interestingly, Apple’s stock price impact is actually greater in the market-capitalization-weighted S&P 500 than the 30-company DJIA. Says MarketWatch, “The Dow is a price-weighted index, which means the price is determined by the price changes of its components, rather than percentage changes.)
- Apple is represented in 190 ETFs, says Bloomberg, about 10% of all ETFs.
- Apple is the largest holding in four of the top five ETFs, with ETF rankings determined by total assets. In those four ETFs, Apple holdings are, on average, about 3.1% of each ETF’s total holdings.
- If Apple were a foreign “country,” it would be the third-largest that U.S. investors have exposure to, after China and Japan.

“For ETF investors, Apple stock is a lot like the Apple devices: It’s everywhere. … Investors may be particularly overexposed to Apple, if they invest in the big-name, broad-market ETFs. … Apple’s inclusion in so many ETFs can mean many investors probably are not as well diversified as they think, especially as a large proportion of them likely [also] own Apple shares.”
