

Many traders—especially those relying on traditional metrics—have been somewhat blindsided by the market’s sharp decline through most of January 2016. But there is precedent for this, and there were certainly warnings (more about that in a minute). But the real question is, will the market rebound from here, as it did from a bad January of 2015? Or is there a more severe outcome ahead, as occurred after a very similarly bad January of 2008?
A very specific warning—not necessarily about the size of the current decline, but about its timing—came from the Santa Claus Rally theory. This was first written about in 1972 by Yale Hirsch, founder of the Stock Trader’s Almanac.
The Santa Claus Rally encompasses the last five trading days of one year and the first two of the next year. The market usually rallies during that time, and then all is well. But let’s remember what Mr. Hirsch said, “If Santa Claus should fail to call, bears may come to Broad and Wall.” In other words, if the typically bullish Santa Claus Rally period produces a negative result, a sell-off often follows. It certainly has this time.
Another, longer-term weakness in this market has been cumulative breadth, and that is still a problem. Cumulative breadth is the running sum of daily advances minus declines. Using “stocks only” data is purer than using NYSE data, which is encumbered by things that are not stocks. The “stocks only” cumulative advance/decline line made its highs in July 2014 and has not been able to rise much above them since, even though the broad market moved higher during the same period. This type of negative divergence is not a timing indicator, but it does mean that one should not ignore sell signals while the divergence is in place.
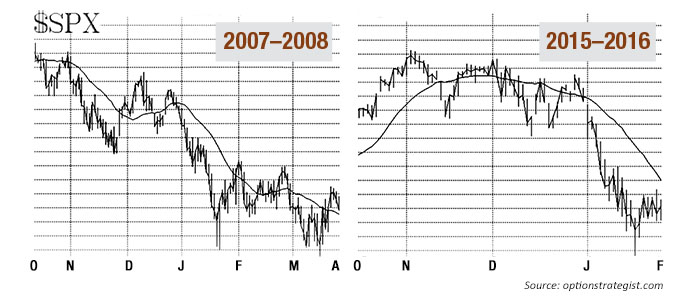
This year the market gave up about 210 S&P 500 (SPX) points, or 10%, from its late December levels, with the decline halting just before the Martin Luther King Jr. holiday. However, it was a shaky recovery until Friday, January 29. In 2008, a very similar pattern occurred: The SPX declined 230 points, or 15.3%, from its late December highs to its lows just after MLK Day.
In both 2008 and here in 2016, the market embarked on a strong rally after the 18th trading day of January. This is a seasonal pattern that has a lot of credibility. In 25 of the last 30 years, there has been a rally beginning after the 18th trading day and lasting for four days. It seems that a severe sell-off earlier in the month makes that seasonal move even stronger.
Furthermore, the paths of the CBOE Volatility Index (VIX) in January 2008 and in January 2016 have been very similar. In both cases, it seemed as if VIX didn’t really spike as high as it should have, considering the speed and depth of the SPX decline. In other words, traders were perhaps unwilling to create a panic high in VIX (and thus didn’t create a panic bottom in the stock market).
So, there is a lot of similarity between January 2008 and January 2016. I am not suggesting that the rest of the year is necessarily going to go the same way, but the first few months might. In February 2008, the market pulled back immediately after the January seasonal pattern had run its course. In fact, the highs of early February 2008 stood for over two months. Meanwhile, the lows were tested and briefly violated in March 2008.
It was only then that a stronger rally took place, leading to highs in May. After that, there was a strong downward move in June–July 2008, and then, of course, the disaster in the fall months. While a complete repeat seems unlikely, it does seem that a retest of the lows, and a possible violation of them before a stronger rally gets underway, could well be the course the market takes again over the next few months of 2016.
 Professional trader Lawrence G. McMillan is perhaps best known as the author of “Options as a Strategic Investment,” the best-selling work on stock and index options strategies, which has sold over 350,000 copies. An active trader of his own account, he also manages option-oriented accounts for clients. As president of McMillan Analysis Corporation, he edits and does research for the firm’s newsletter publications. optionstrategist.com