

For most equity indexes, this advice has usually been true for more than 50 years. But, there are certain equity sectors—when coupled with government-bond strategies—that historically have good odds of success during those months. And, even when these sectors have not seen particularly successful results, at least they have not been part of a downside blowout.
Measuring June–August returns, volatility, and portfolio drawdown going back to 2003, an advisor who is shooting for a lower-volatility strategy with a potential growth component could have considered a mix of 30% equity sectors and 70% government bonds (the bond ETFs: SHY, IEF, and TLT).
Creating a 13-year equity curve that focuses on each year’s June–August results only shows negative returns and large monthly volatility for the materials, financial, and industrial sectors. The energy sector had a slight gain for the past 13 years, but was wildly volatile. So, all of these would not make the cut for my suggested strategy.
On the flip side, the technology, consumer staples, health care, utilities, and discretionary sectors showed positive results. The utilities sector was the clear winner for return during the summer due to its closer correlation to government bonds. Its standard deviation of that three-month return was almost identical to 20- or 30-year government bonds. Returns for the technology and discretionary sectors were slightly better than energy, but the volatility was markedly less. As expected, consumer staples and health care—the more defensive sectors—produced decent returns with much less volatility than the other seven sectors.
Now, let’s get back to the allocation of 30% equity and 70% bonds. Frankly, looking at all of the Junes for the past 13 years did not bode well for any of the sectors except utilities. Of course, there have been years where many diverse equities have “rock ‘n’ rolled,” bucking the “sell in May and go away” mantra. Ignoring equities in June altogether probably has elements of lost opportunity costs if that event occurs.
From a seasonal standpoint, July and August are a tiny bit more forgiving than June. But creating an overall summer exposure of 30% to equities helps keep one in the equity game in case it is one of those rock ‘n’ roll years. A 70% allocation to government bonds nods to the statistical odds and can help offset damage in case rock ‘n’ roll turns to “death metal” for equities.
Singling out each month for each sector can yield some putrid downside results—ranging from -6% for staples to -17% for financials. Upside potential for a single month has been as high as 13% for materials and financials. However, in the sector selection process, four of the five sectors illustrated for the equity allocation had single-month loss or gain within a range of -10% to +10%.
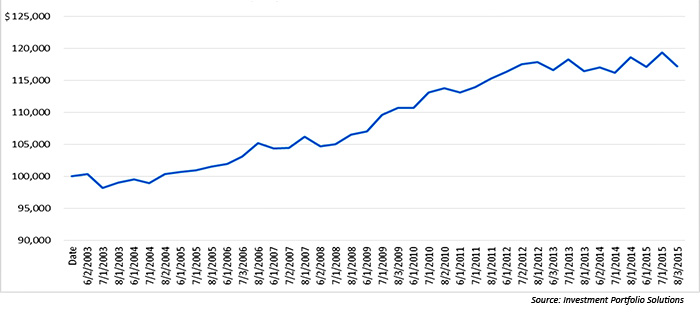
The final results from May 31, 2003, to August 31, 2015, are hardly blockbuster, but do offer consistent return with less volatility and drawdown.
Using the equity sector ETFs XLK, XLP, XLU, XLV, and XLY (6% allocation each), offset with the bond ETFs SHY and IEF (35% allocation each) has yielded an average of 1.25% gain for the June–August periods. This tactical strategy would also have reduced standard deviation by 74%, compared to a 50% allocation to all nine equity sectors and a 50% allocation to the three government-bond ETFs of SHY, IEF, and TLT.
The worst drawdown in June–August periods for the past 13 years is -2.14%. The best return is 3.91%, and the worst return is -1.20%. The number of positive three-month periods is 10 of 13, or 77%. That could be a potential cure for any investor’s summertime blues.
$100,000 INVESTED IN THREE-MONTH “SUMMER STRATEGY” ONLY
(30% EQUITY/70% BONDS)
 Ian Naismith is a partner and the index designer of Smooth Sailing Indexes Inc., which is a leader in tactical “risk-on/risk-off” index development. Mr. Naismith has been analyzing and trading the markets since the early 1990s. He is a member of the National Association of Active Investment Managers (NAAIM) and has also served as board member and president. www.smoothsailingindexes.com