

The first half of 2018 was characterized by a relative return to volatility, an extended period of down-to-sideways action for many U.S. equities, and several asset-class and equity sectors that bucked that trend.
For several major market indexes, 2018 has been largely disappointing, based in part on the Fed’s interest rate increases, ongoing concerns over trade and tariff policy by the Trump administration, and the fact that markets may have gotten ahead of themselves in 2017. This disappointment has been especially pronounced given robust S&P 500 earnings, the anticipated impact of tax policy, a continued positive employment trend, and hopes for accelerating U.S. GDP growth.
The Wall Street Journal wrote this past weekend about Q2 2018,
“Stocks were all over the map in a jittery quarter as investors dumped industrial stalwarts on fears of a trade war stifling global growth and increased their bets on shares of large technology companies. Indexes finished the tumultuous three months mostly higher, even as investors were buffeted by worries about trade tensions and political uncertainty in the eurozone, as well as signs of slowing momentum in the global economy.”
TABLE 1: PERFORMANCE OF U.S. MAJOR EQUITY INDEXES (FIRST-HALF 2018)
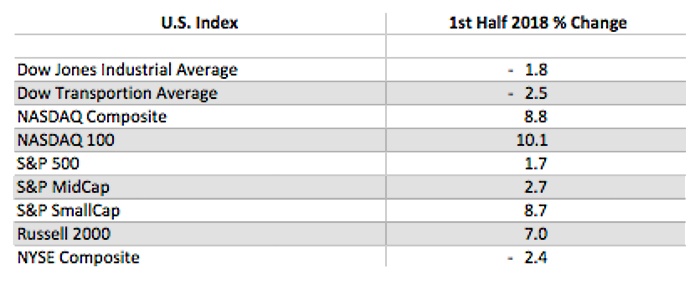
Source: Market data, index return only
While investors found pockets of strong performance in the U.S., especially in tech stocks, the picture for international stocks has been much bleaker. The market indexes for both major industrialized countries and emerging markets were almost universally in the red for the first half of 2018.
TABLE 2: PERFORMANCE OF NON-U.S. MARKET INDEXES (FIRST-HALF 2018)
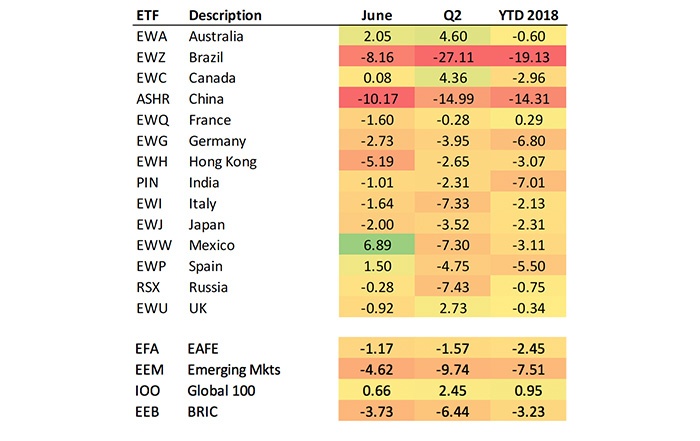
Source: Bespoke Investment Group, total return basis
Among commodities, oil had an impressive run in the first half, while the performance of gold has been lackluster, showing continued weakness in Q2.
TABLE 3: PERFORMANCE OF COMMODITIES (FIRST-HALF 2018)
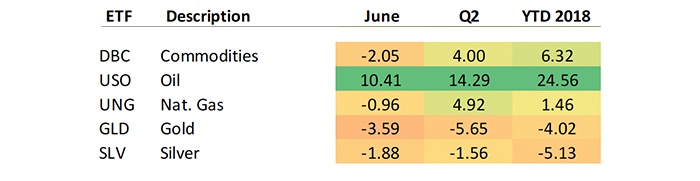
Source: Bespoke Investment Group
For U.S. stock market sectors, Consumer Discretionary led all segments in positive performance, followed by Technology, while Consumer Staples and Telecom were the weakest sectors.
TABLE 4: PERFORMANCE OF U.S. MARKET SECTORS (FIRST-HALF 2018)
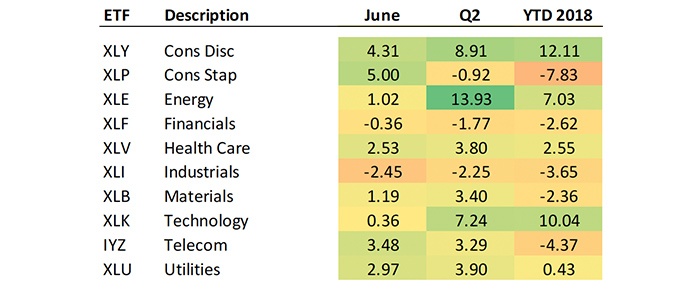
Source: Bespoke Investment Group
Despite the mixed performance of the various sectors, overall growth in S&P 500 earnings continues to be impressive.
TABLE 5: 2018 ACTUAL AND ESTIMATED S&P 500 EARNINGS GROWTH
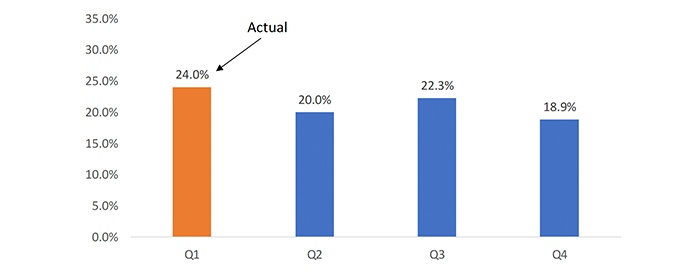
Source: Bespoke Investment Group, % year-over-year earnings growth
However, earnings growth for Q1 2018 varied widely by sector, with the Energy sector far surpassing all other areas.
TABLE 6: S&P 500 EARNINGS GROWTH BY SECTOR (Q1 2018)
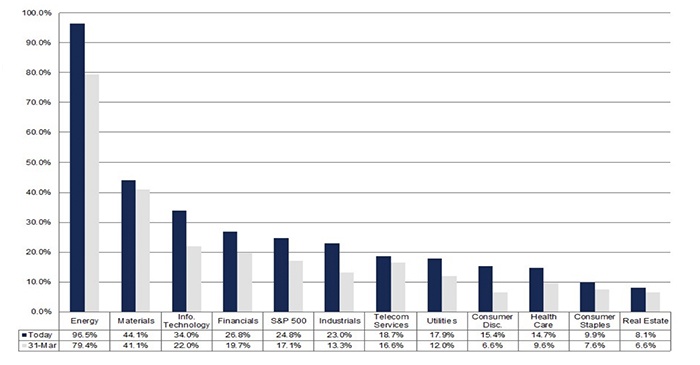
Source: FactSet
Technology stocks have really been the story of 2018 so far, with large-cap tech stocks holding many of the top positions among the largest market-capitalization stocks and continuing to add to that. Says Bespoke Investment Group,
“In 2017, the five FAANG stocks all soared 30% or more, and they’ve picked up right where they left off in the first half. While GOOGL, AAPL, and FB have only posted gains of 7-11%, AMZN and NFLX are up 46.7% and 105.8%, respectively.
“In 2017, the five FAANG stocks added $851 BILLION in market cap, while the rest of the Russell 1,000 added $3.7 trillion. Even more remarkably, so far in 2018, the five FAANG stocks have added another $523 billion to their market caps, while the rest of the Russell 1,000 has added just $183 billion.”