
Are business cycles still meaningful?
Are business cycles still meaningful?

Business cycles—and investment assets—will invariably revert to the mean given a long enough period of time. Though behaviorally difficult at times for clients, advisors need to advocate sticking to a long-term game plan of dynamic, risk-managed portfolio construction.
Business cycles and the economy do not grow linearly in one direction over time. Business cycles occur due to fluctuations in economic growth, which of course impacts revenues, earnings, margins, and overall GDP. There is an equal and opposite reaction to every action.
This applies to business cycles as well. Prolonged periods of economic growth or short bursts of intensive growth are eventually followed by rising inflation rates or the threat thereof. The higher prices resulting from inflation usher forward countercyclical policies to restrain the inflationary pressures. This cyclical pattern continues to repeat. In addition to monetary policies designed to control the temperature of the economy, fiscal policies such as tax law changes also account for the ebb and flow of business-cycle patterns. Noneconomic factors such as war, drought, and natural disasters also impact these cycles.
Just like seasons of the year, there is a continuous pendulum that shifts from one stage of a business cycle to the next. The problem is that while in the middle of a cycle, and definitely when at its deepest part, it is easy to be convinced that the current cycle will last indefinitely.
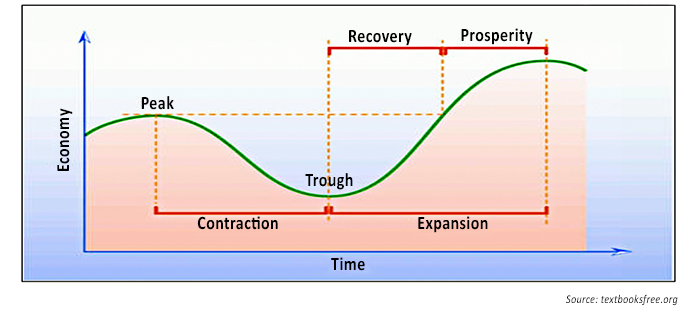
FIGURE 1: THE BUSINESS CYCLE MEASURES FLUCTUATING BUSINESS ACTIVITY
Drivers of the economic cycle
There are six main economic drivers that underlie a business cycle. These include the employment rate and new jobless claims, labor costs, capacity utilization, commodity prices, changes in business inventories, and worker productivity gains. Monetary policy from the Federal Reserve exerts a strong influence over the entire business cycle, impacting credit availability and many other factors driving business growth.
In the “spring” (early-cycle phase) of a business cycle, the economy begins emerging from the brutal cold of an economic recession. Unemployment and negative sentiment are just starting to wane, and business activity starts to expand amid looser credit conditions. Believing that the market has bottomed, corporate insiders and savvy value investors begin to buy, figuring that the worst is over. These investors are contrarian because they are willing to go long while the general market remains bearish. At this stage, articles in the media continue to warn about doom and gloom, and most of the investors who had previously been long have recently capitulated.
When the media begins to talk up the quality of the market, the strength of the business cycle, and corporate profitability, it is an indication that the “summer” season, or mid-cycle phase, has arrived. During this phase, a majority of retail investors may come back into the market and volumes and valuations soar. Although insiders, savvy money managers, and value investors may begin exhibiting some caution, those on the sidelines see the recent trend as a buying opportunity and follow the flock. Prices will eventually make a final parabolic move higher, known in technical analysis terms as a selling climax, as sentiment moves closer to euphoria.
Through the emergence of the euphoric stage, the risk appetite of the average investor (and some institutions) becomes relentless. This hunger promotes IPOs, mergers, acquisitions, and debt issuance. Insiders and the “smart money” are motivated to cash in before it becomes too late. These are indicators that the “fall” season (late-cycle phase) has arrived. When business activity contracts, credit is tight, high volatility arrives, and corporate bankruptcies elevate, the buying climax is over, and it indicates that the “winter” season (recession) of the business cycle is present.
Ed Easterling of Crestmont Research identifies three contributors to secular stock market cycles. They are earnings growth, dividend yield, and the change in the price to earnings ratio (P/E) over the investment period. Earnings growth is directly related to economic growth and business cycles. Dividend yield is driven significantly by the level of valuation, or P/E at the time of investment. The level and trend of P/E are driven by the inflation rate. Low and stable inflation drives P/E higher, whereas inflation and deflation drive P/E lower. P/E ratios peak during periods of low and stable inflation and decline during periods of deflation when there is a decline in the nominal level of future cash flows. They also decline during periods of high inflation as corporate cash flows become less valuable.
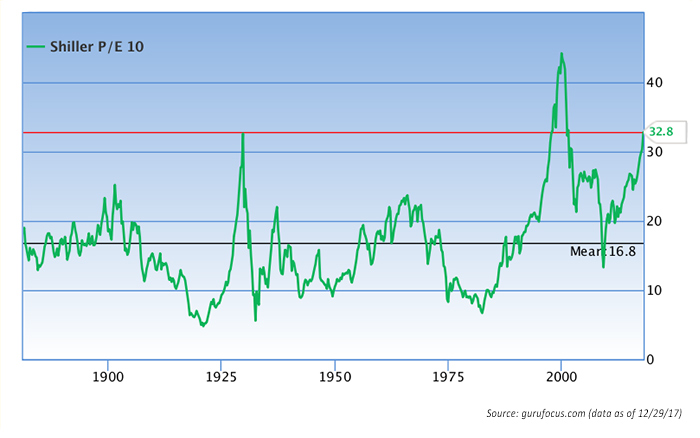
Professor Robert Shiller of Yale University developed the Schiller P/E (also known as the P/E 10 ratio) in an attempt to provide an alternative measure of the market’s valuation. According to the analytical website Guru Focus, the Schiller P/E is a more reasonable market-valuation indicator than the classic P/E ratio because it eliminates fluctuation of the ratio caused by the variation of profit margins during business cycles. The Schiller P/E in December 2017 was 95% higher than the historical mean of 16. As can be seen in Figure 2, this level was last reached during the market’s steep advance before the dot-com crash of the early 2000s.
FIGURE 2: HISTORICAL TREND FOR SHILLER PRICE/EARNINGS RATIO
A long “expansion” with contradictions
Although there have been some blips along the way since the end of the last recession—which coincided with the financial crisis—it appears to me that most investors are starting to believe that economic cycles move in only one direction and continuously expand!
Jim Puplava, the host of Financial Sense, provides an array of related data points. He reported that October 2017 marked the 100th month of business expansion in the U.S. This milestone is three times longer than the average expansion since the Civil War. Because fiscal and monetary interventions did not really become fashionable until after the Second World War, we could limit our comparison of the current business cycle to all others post–World War II. Under this metric, this current cycle is 50% longer than the average. In fact, there have been just two other times since the end of the Second World War when the economy has expanded for at least 100 months.
To provide additional context, if the current business expansion continues until May 2018, it will mark the second-longest business cycle on record. According to Fidelity Investments, the U.S. economy experienced 11 business cycles between 1945 and 2009, with the average length of a cycle lasting a little less than six years. The average expansion during this period lasted 58.4 months, while the average contraction lasted 11.1 months. Perhaps the greatest conundrum currently relates to the fact that (notwithstanding the magnitude and duration of the current expansion as well as historically low unemployment rates) we have seen very little wage inflation in the country. In fact, as reported by the Economic Policy Institute, income levels today for many households are barely back to 2007 levels. Furthermore, most of the income growth is being distributed among wage earners within the top 5% category.
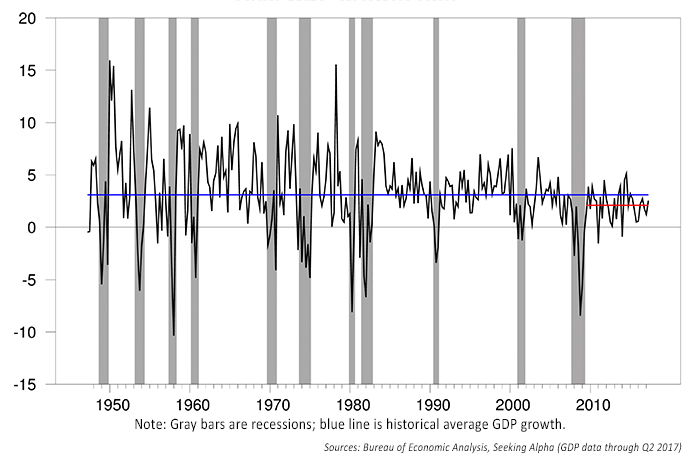
Moreover, volatility in the markets has basically evaporated. Few forecasters see a recession anywhere on the horizon. Yet, as Ed Easterling points out, since 1860, every decade in the U.S. has experienced at least one recession. In fact, many of the decades have been mired in recession for 25% and more of the time. Since 2007–2009, the U.S. has avoided a recession. If we go another two years without one, it will be one of the longest stretches since the 1800s. While GDP growth has picked up in 2017, and the Fed and The Conference Board see the possibility of 2.5% growth in 2018, this is still below the annual average of 3.2% growth since 1948.
FIGURE 3: REAL GDP GROWTH VS. RECESSIONARY PERIODS
Personal observations on the current business cycle
What are we to make of the fact that despite a historically long business cycle, incredibly loose monetary and fiscal policies, low and steady inflation, historically low interest rates and unemployment, we are still experiencing the slowest sustained level of growth in an expansion since World War II, and wages are stagnant? Is there something going on under the hood that makes this business cycle particularly unique and vulnerable that may be escaping the radar? And has this business cycle elongated based on monetary and fiscal policies coupled with sentiment?
To say that quantitative easing and low interest rates have not contributed to the vitality of the cycle is naïve. For one thing, from the period since 2014 when the last round of quantitative easing ended until the presidential election, the U.S. market literally flatlined and went nowhere. The perceived pro-growth Republican agenda, coupled with low inflation and a slow-moving Federal Reserve, have moved the mainstream as well as Main Street to believe that we are in a goldilocks economy that is far from reversing. The VIX breached its lowest level ever in November 2017, which I consider a warning signal in that it is an indication that sentiment has now reached euphoric levels.
The majority is acting like it’s the “summer” season, and that it will never end. Meanwhile, when we lift the hood, we see that the indexes that are making continual record advances are being upheld by fewer, but more dominant issues. Apple, Amazon, and Facebook collectively comprise nearly 25% of the NASDAQ. Boeing, Goldman Sachs, United Health, McDonald’s, and Apple comprise nearly a third of the Dow Jones Industrial Average, according to data provided by Jim Puplava.
In addition to sentiment leading to such a concentration in index investing and the extension of the business cycle, so too has debt. The constraints of debt issuance following the financial crisis have been lifted to the point where debt loads of individuals, corporations, and governments are once again extremely elevated. The debt seems benign, as asset values to which the debt is assigned soar and cheap money makes servicing the debt inconsequential. Because of debt and the lack of better alternatives in a suppressed interest-rate environment, some notable P/E ratios have blown out to the point where, for example, Amazon is trading at 200 times earnings while it is barely profitable.
How should advisors be counseling their clients?
What happens when the music stops and the next business cycle finally surfaces? What happens when people finally capitulate on their investments only to find that in a market dominated by such a concentration of powerful players there is no one left on the other side of the trade? Today we have dual bubbles building simultaneously. We have the bubble of passive investing combined and fueled by the belief that the “summer” business cycle will last indefinitely.
I continue to counsel my clients that whether they believe we are in a market bubble or not is, in one sense, largely irrelevant. A new recession and market correction will occur—it is a matter of when, not if.
As a team, we need to remain faithful to the principles of what I believe are sound investment-management practices no matter where the business or market cycle lies, including the following:
- Staying true to the goals-based objectives of their financial and investment plans, and not worrying about what a particular broad market benchmark is doing. Does it make sense to “chase” the returns of the S&P 500 in a bull market, knowing that same index has historically suffered bouts of 30%–50% losses in bear markets?
- Using a holistic approach to portfolio strategies that inject a strong dose of risk management. While such an approach will likely not catch the highest highs of the market, it is intended to keep investors from coming near the lowest lows. I tell clients that “two steps forward and the occasional one step back” will lead to consistent portfolio growth over the years, as opposed to five steps forward and a figurative fall all the way back to the bottom landing of the staircase.
- Explaining to clients the benefits of active management for at least a part of their portfolio. While actively managed strategies, as I see them, have an important objective of limiting the occurrence and magnitude of negative returns, they can have other key benefits for clients. There are many tactical strategies available, including trend-following, mean reversion, and sector rotation, that can help client portfolios stay in tune with the various phases of business and stock market cycles. In my practice, I stress the importance of having a well-balanced portfolio that can include both offensive and defensive strategies.
Gregory Gann is a registered representative with, and offers securities and advisory services through, LPL Financial, a registered investment advisor. Member FINRA/SIPC. All indices are unmanaged and may not be invested into directly. Tactical allocation may involve more frequent buying and selling of assets and will tend to generate higher transaction cost. Investors should consider the tax consequences of moving positions more frequently. The opinions expressed in this article are those of the author and do not necessarily represent the views of Proactive Advisor Magazine or LPL Financial. This material is for general information only and is not intended to provide specific advice or recommendations for any individual. The economic forecasts set forth in this material may not develop as predicted.
 Gregory Gann has been an independent financial advisor since 1989. He is president of Gann Partnership LLC, based in Baltimore, Maryland. Gann Partnership provides objective, unbiased financial planning and active investment management for individuals, families, and businesses. (Securities offered through LPL Financial, a registered investment advisor. Member FINRA/SIPC.) Mr. Gann also serves clients as a certified divorce financial analyst. gannpartnership.com