
As of July of this year, “the U.S. economy has officially entered the longest expansion in its history,” reports PBS, adding the following:
“The nation’s gross domestic product has been growing for the last 121 consecutive months, the metric used to measure periods of sustained economic growth. That surpasses the 120-month expansion from 1991 to 2001. … But the current economic expansion has been slower than previous periods of economic growth. The economy has grown at an average rate of 2.3 percent per year since 2009. In comparison, the economy grew 3.6 percent per year during the 1990s.
“The lackluster growth rate has sparked discussions of whether slower economic growth might be the ‘new normal.’ A combination of unskilled workers and an aging population has likely contributed to the lower growth rate. Around 10,000 baby boomers are retiring each day, and employers have struggled to replace those workers.”
No matter the “quality” of the expansion, there is little doubt that the U.S. consumer has been an integral part of the long trend of economic growth. Economic estimates say that consumer spending and consumption represents close to 70% of total U.S. GDP.
What are some of the metrics indicating the current health of the consumer?
CNBC said last week, “Job growth is steady, the unemployment rate is near a 50-year low, and wages are rising modestly, which bolsters Americans’ spending power.”
This was reflected in the retail sales data for July, which was released last week. The Commerce Department reported that retail sales rose 0.7%, after a 0.3% gain in June. This was far greater than the consensus expectation, which was for another uptick of 0.3%. Online retailers, grocery stores, clothing retailers, and electronics and appliance stores all reported strong gains, according to CNBC.
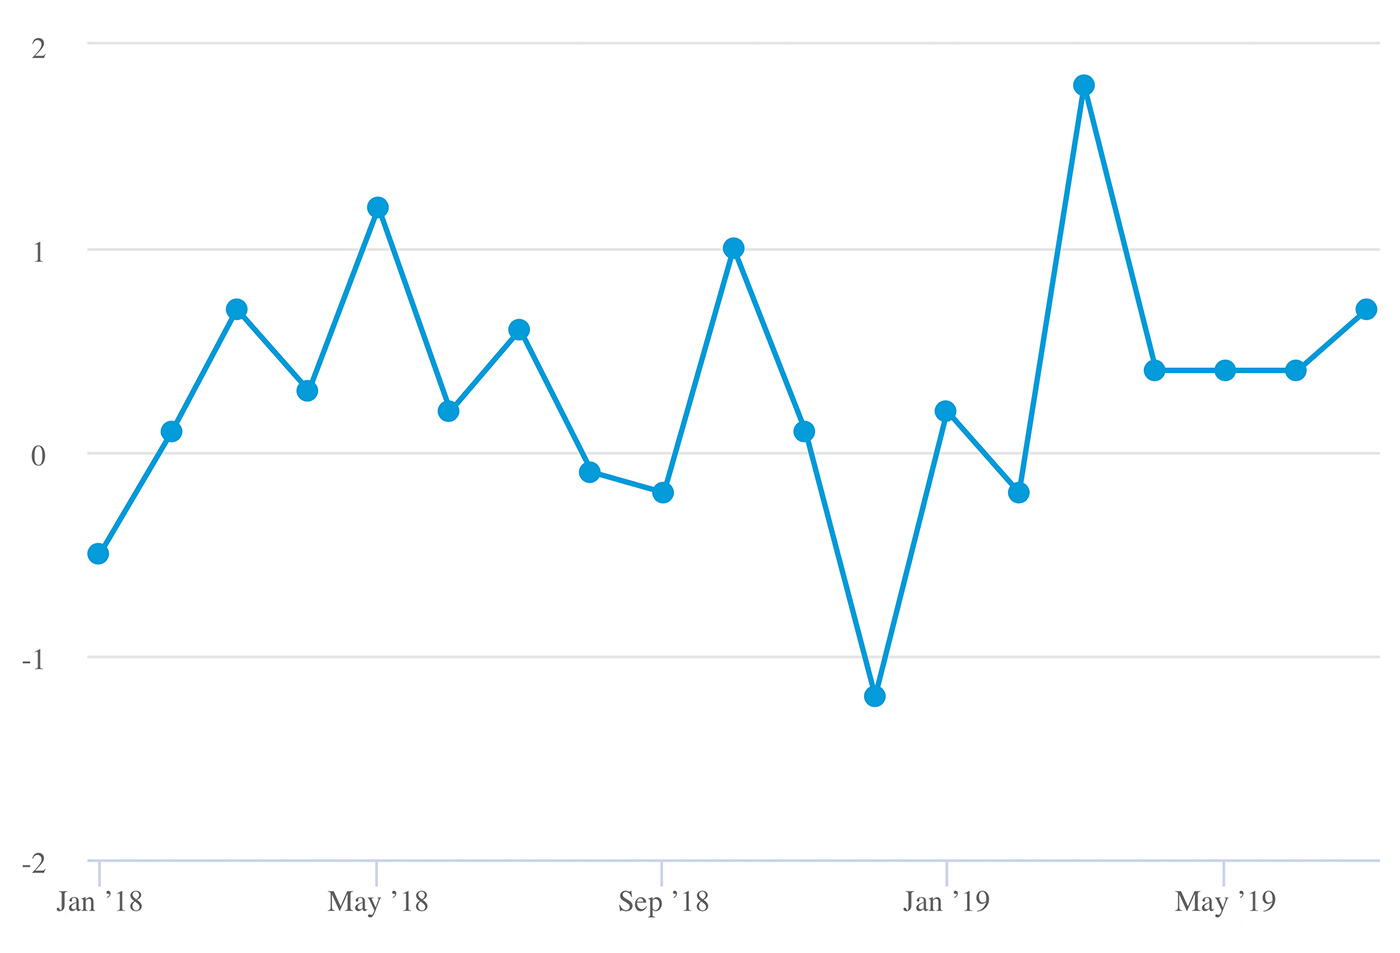
Source: CNBC, U.S. Department of Commerce, Census Bureau
However, the weekly Redbook release for comparable store sales at chain stores, discounters, and department stores was somewhat less favorable, coming in at a year-over-year increase of 4.4%. While this is much higher than the average of 2.6% from 2005–2019, it is showing a slower growth trend over the past six months.
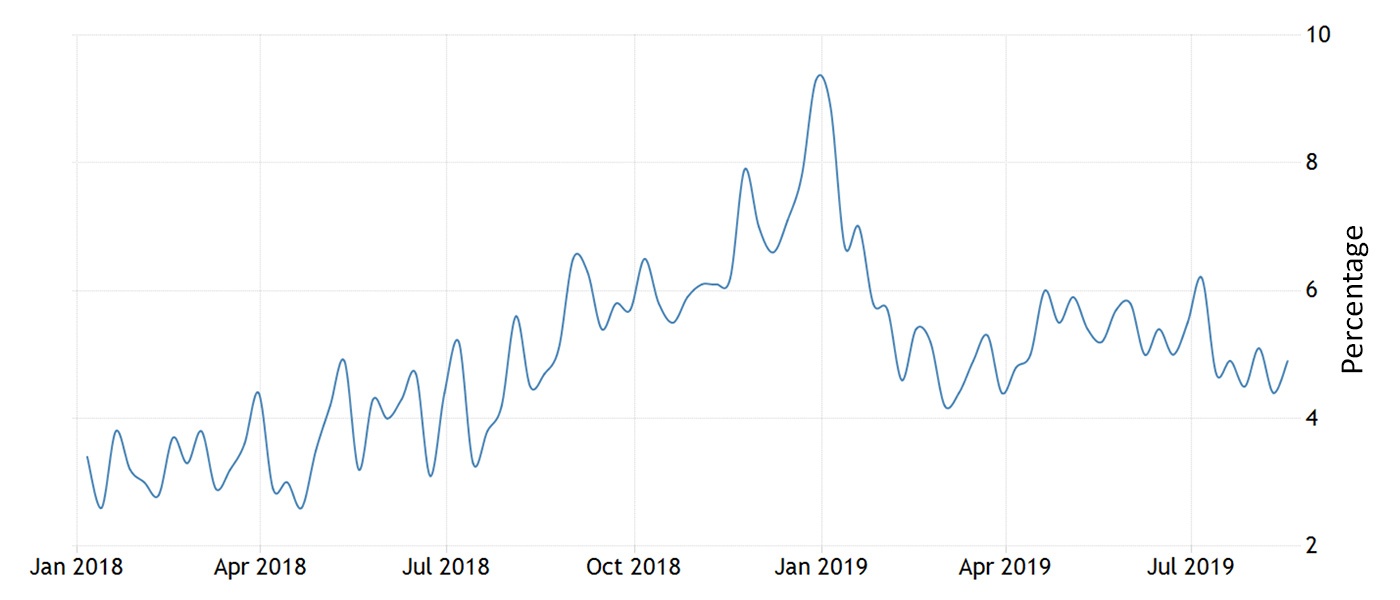
Source: Trading Economics, Johnson Redbook Index
While job creation has been somewhat sporadic in 2019, unemployment remains near historic lows and monthly unemployment claims have not shown any significant spikes. However, according to the Department of Labor release on Aug. 13, “Real average hourly earnings increased 1.3 percent, seasonally adjusted, from July 2018 to July 2019.” This was down from the prior month’s year-over-year increase of 1.5%.
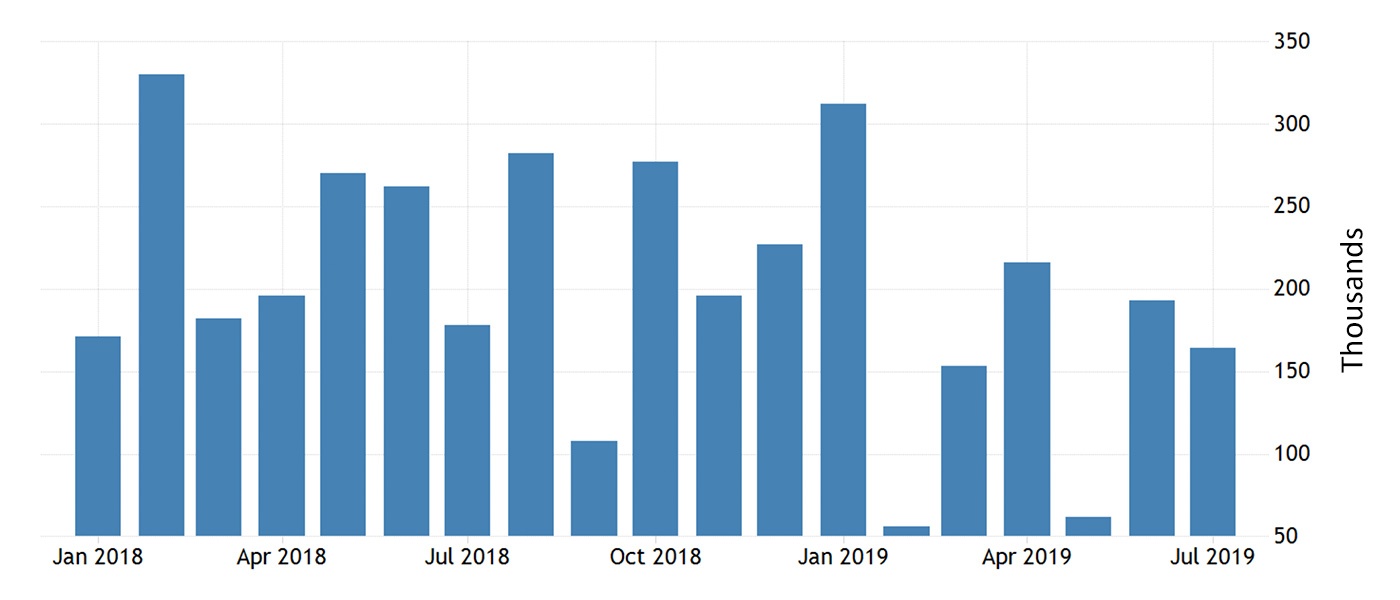
Source: Trading Economics, U.S. Bureau of Labor Statistics
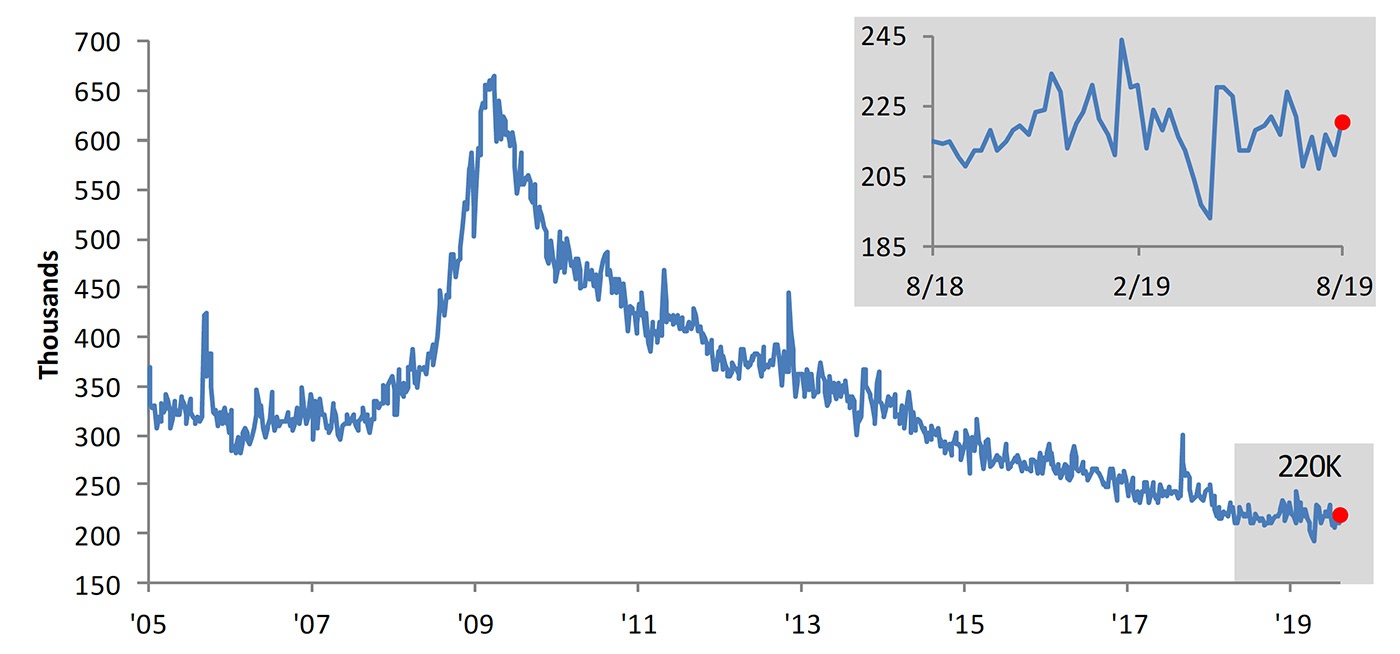
Source: Bespoke Investment Group
Consumers have recently given signs of increased interest in the housing market. On Aug. 14, “the Market Composite Index, a measure of mortgage loan application volume, increased 21.7 percent on a seasonally adjusted basis from one week earlier,” reported the Mortgage Bankers Association (MBA), adding, “The 2019 refinance wave continued, as homeowners last week responded to extraordinarily low mortgage rates. Fears of an escalating trade war, combined with economic and geopolitical concerns, once again pulled U.S. Treasury rates lower. The 30-year fixed mortgage rate decreased eight basis points to 3.93 percent—the lowest level since November 2016—and has now dropped more than 80 basis points this year.”
However, it has not all been refinancing applications. The MBA says July 2019 mortgage applications for new home purchases increased 31.2% from a year ago and were up 11% from June.
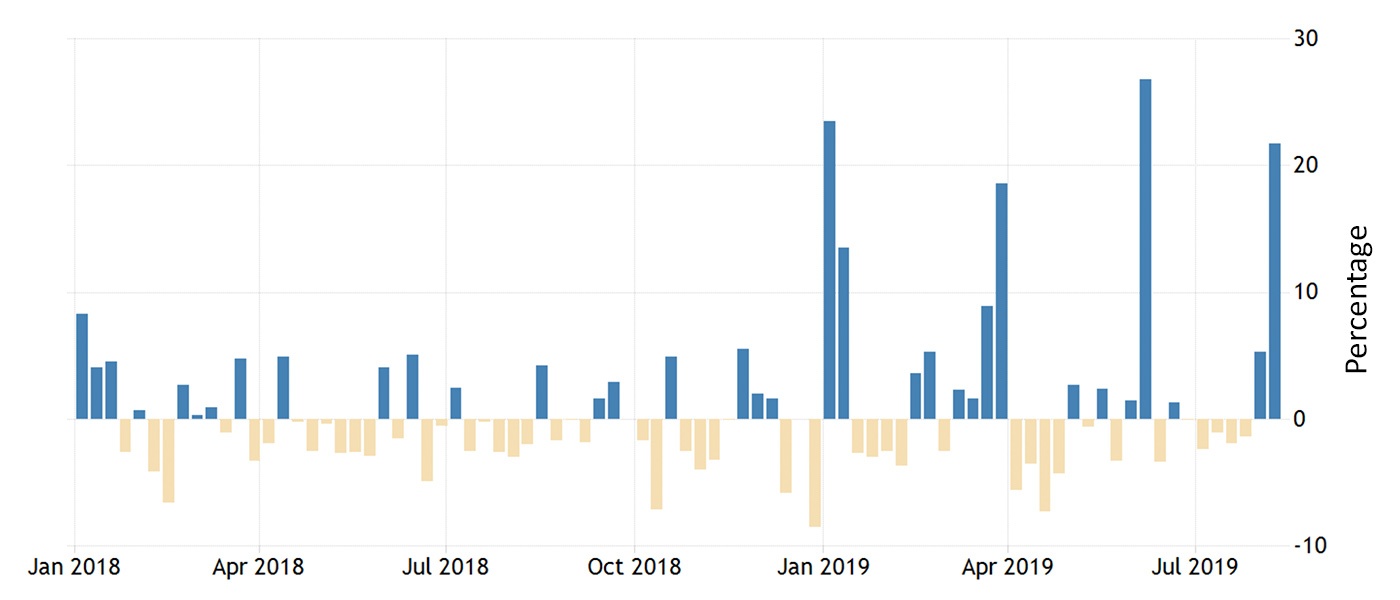
Source: Trading Economics, Mortgage Bankers Association
Despite many of the trends showing that the state of the consumer remains healthy, consumer sentiment has taken something of a hit recently. This is being primarily attributed to stock market volatility, ongoing concerns about the trade war and the threat of new tariffs, and the focus in the financial press on the possibility of a recession looming in the next year or so.
According to Bloomberg’s Consumer Confident Index, consumer sentiment experienced its biggest two-week slump since 2011, falling 1.7 points to 61.2 for the week ending August 11. The Comfort Index also saw the comfort gauge of the economy slide to 62.9, a decline of 4.6 points, and the personal finances index fall to 65.7.
In addition, the University of Michigan’s preliminary August consumer sentiment index slumped to 92.1 from July’s 98.4, well below expectations.
According to Bloomberg, “The gauge of current conditions decreased to 107.4 while the expectations index dropped to 82.3, bringing both readings to the lowest levels since early this year. … The second-lowest confidence reading of Donald Trump’s presidency shows consumer spending, the biggest part of the economy and largest driver of expansion in the second quarter, may be at risk of wobbling amid financial-market volatility and the trade war. A weakening in that pillar of support, if sustained over time, has the potential of suppressing economic growth or worse, bringing an end to the record economic expansion.”
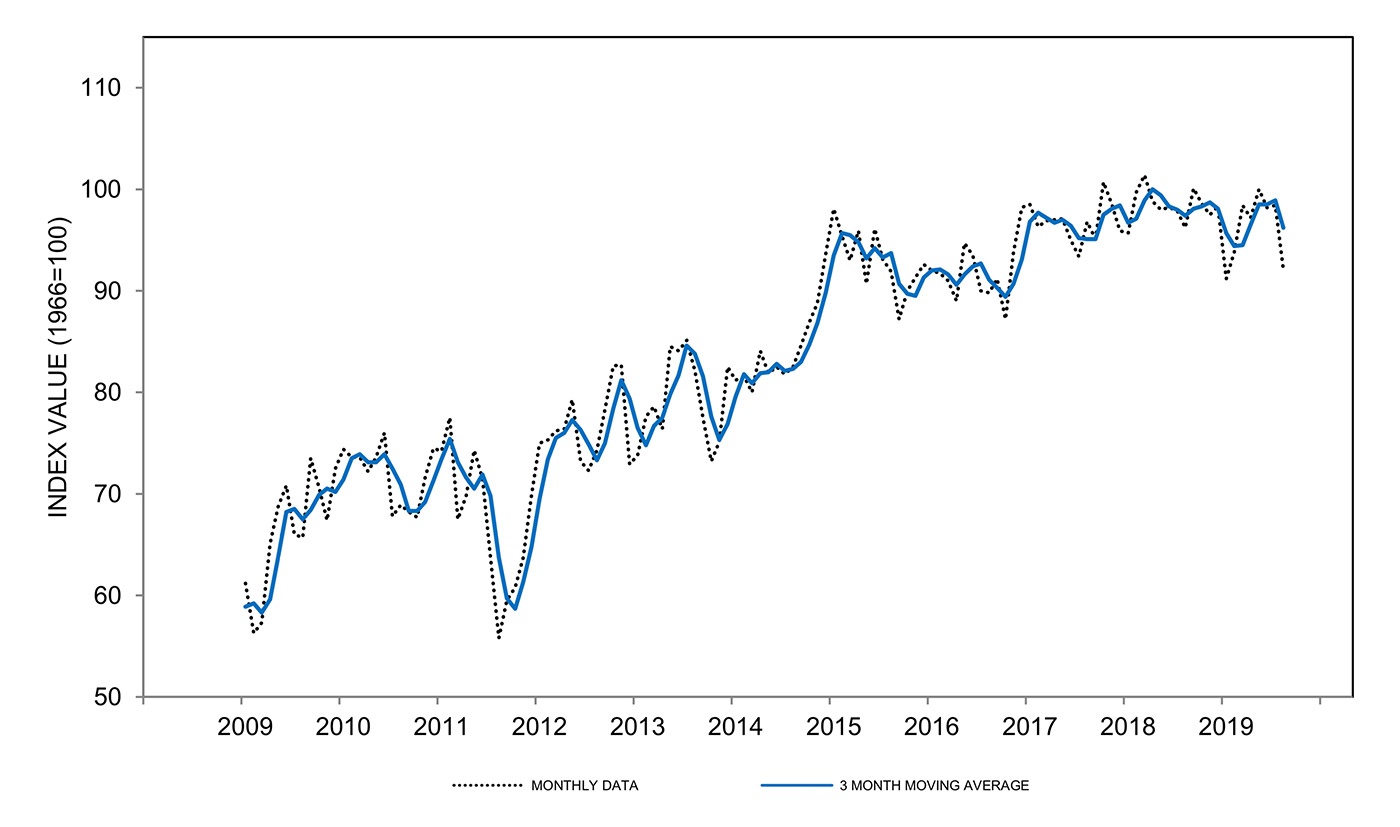
Source: University of Michigan, Surveys of Consumers
