
What do the cycles say about February 2014?
What do the cycles say about February 2014?

What might the decline in January mean for the rest of the year? While it might seem incredible that the result from a single month of price action could have predictive powers, history shows this can be true. The bottom line is that when the S&P 500 sports a loss for the month of January, especially during January’s following a strong return in the market the year before, the ensuing 11 months tend to be down.
The good news is that January is over. But the bad news, at least as far as our cycle work suggests, is that February has begun. After a punk January, the S&P started off February on a really lousy note. If I have the statistic right, Monday’s (2/3) shellacking was the worst first day of February since 1933. Ouch.
So, since everyone in the game right now is basically waiting for Friday’s jobs report to either confirm that “growth slowing” is a thing this year or that the worries have been misguided, we thought this would be a good time to take a peek at what the historical cycles say about what February may hold in store.
(Editor’s note: The Friday (2/7) jobs report disappointed on the topline, with 118,000 jobs created versus consensus expectations of 181,000, but some more positive notes were found in the household survey versus the payroll numbers. So, throwing in the very dismal weather for January, some contradictory and inclusive results.)
Time to review the cycle projections
The bottom line is that the review of cycles should not be used in a vacuum or as a stand-alone indicator. Using only the cycle composite projection, or any other indicator for that matter, to guide your investing decisions is a fool’s game.
With that said, however, we continue to check out what the cycles suggest might happen on a daily, weekly, and monthly basis. In fact, this data continues to be an important input into our daily and weekly Market Environment models.
What is a cycle composite?
Our monthly analysis of the cycles (the closest thing we have to a crystal ball) is a combination of the one-year seasonal, the four-year presidential, and the 10-year decennial cycles—all going back to 1928.
By combining these three cycles, a cycle composite is produced. And while expecting the market to follow the cycles exactly is just plain silly, it is surprising how often the market tends to follow the general direction of the composite—especially when viewed from a long-term perspective.
Is the market in sync with the cycle projections?
The first step in the analysis of the cycles is to get a feel for whether the cycle projections are “on” or not at the present time. Looking at how the market acted relative to the cycle composite’s projection for January, we will have to answer the question with a resounding “No!,” as the stock market went almost exactly opposite the projection for last month.
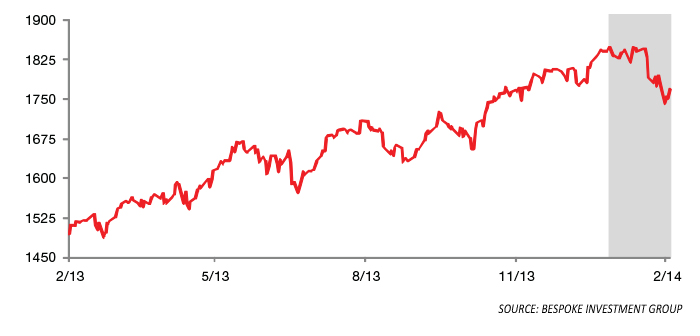
In short, January is supposed to have been a steady march higher; not a rendition of Humpty Dumpty falling off the wall, as shown in the chart below.
However, from a longer-term perspective, the market (as defined by the S&P 500) continues to be largely in sync with the composite projection. For example, since 2010, the S&P is only a percent or so away from where it has been projected to be at this time.
Sure, the ride has been bumpy and there have been times that the market has diverged—sometimes rather dramatically—from the projected path. But four years and a multitude of crises later, it is incredible that the market is still in sync with its historical cycles.
S&P 500: Last 12 Months
What does February look like?
The next step is to take a look at what the cycle projections are calling for during the coming month:
Four-year cycle: The four-year presidential cycle projection projects a bit of a challenge for stocks in 2014. This is the second year of the president’s term, and the bottom line is there tends to be a rather substantial decline during this period. While the cycle projection doesn’t suggest any real trouble until the second quarter, it is worth noting that the timing of such events is always flexible. Therefore, traders who follow such things are concerned that the meaningful decline being projected by the cycles may have started a little early.
The S&P 500 cycle composite: The overall cycle composite suggests that February will be a somewhat negative affair. Although stocks are not following their cue right now from the cycle composite, the projection is for an early advance followed by a sharp pullback, a rally, and another decline.
The NASDAQ’s cycle composite: This year we’re also going to take a look at what the cycle composite has to say about the NASDAQ each month. The reason being that the projection for the tech-heavy NASDAQ Composite is very clear: a serious decline lies ahead. In short, starting in February, the NASDAQ is projected to trace out a saw-tooth decline that is briefly interrupted in March but is then pretty much straight down at a 45-degree angle until October.
What’s interesting is that while the S&P is running exactly opposite of its cycle projection at the present time, the NASDAQ is largely in line with its cycles. Sure, the decline we’re seeing right now is worse than the cycle had called for. However, the conflicted projections between these two indexes remain something to pay attention to this year.
In summary
The S&P has been moving opposite the cycle composite, while the NASDAQ is largely following the script. The good news here is that after a period of sideways consolidation, the next move the NASDAQ’s cycle composite calls for is a rally. The takeaway here is that this may be a year to play your cards close to the vest and to book profits whenever you have them.
(Editor’s note: Some interesting data from Bespoke Investment Group suggests that all is not lost after a poor early start to February, and the current snapback rally through Tuesday (2/11) is encouraging.)
The opinions and forecasts expressed herein are those of David Moenning and may not actually come to pass. Moenning’s opinions and viewpoints regarding the future of the markets should not be construed as recommendations. The analysis and information in this report is for informational purposes only. No part of the material presented in this report is intended as an investment recommendation or investment advice. Neither the information nor any opinion expressed nor any portfolio constitutes a solicitation to purchase or sell securities or any investment program.
The opinions expressed in this article are those of the author and do not necessarily represent the views of Proactive Advisor Magazine. These opinions are presented for educational purposes only.
 David D. Moenning is chief investment officer at Sowell Management Services, an independent RIA firm focused on modern portfolio diversification. Mr. Moenning has been a full-time money manager since 1987 and is also the founder of Heritage Capital Research. Mr. Moenning is a former president and chairman of the National Association of Active Investment Managers (NAAIM). heritagecapitalresearch.com