

- Disarray in the Trump administration and the threat of the Mueller special counsel investigation.
- Washington’s lack of progress on health care, the debt ceiling/budget process, and the promised Republican growth/tax-revision agenda.
- The extremely unpredictable and dangerous situation with North Korea.
- Continued fallout over Brexit, the European refugee and security crisis, and the uncertainties of new political coalitions likely to follow Germany’s election in September.
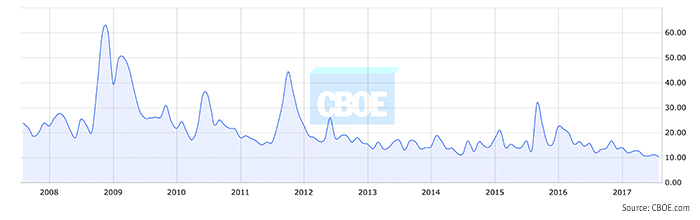
The CBOE Volatility Index (VIX Index), a key measure of market expectations of near-term volatility conveyed by S&P 500 stock index option prices, put in a record-setting number of closes below 10 in late July.

What also has many traders’ attention, however, is that August, September, and October are typically three of the four most volatile months of the year. While August has certainly not shown this yet, the VIX typically has its highest positive monthly gains in this month, according to Schaeffer’s Investment Research. Further, Schaeffer’s data shows that August, September, and October have averaged 60% higher standard deviation for the VIX over the past 25 years than in the remaining nine months of the year.
How has this impacted actual monthly market returns? According to Asbury Research’s data (Figure 3), August has been essentially a flat month since 1957, September has been the worst month of the year, and October has been positive (despite its place in history as a month for “crashes”).

“Never mind strategists warning of a potential VIX rebound, or historical data showing the index tends to jump the most in August. The number of short positions on VIX futures has hit a fresh peak, and an exchange-traded fund that benefits when volatility falls just saw its biggest weekly inflows since June, following three weeks of withdrawals. That’s even as the CBOE Volatility Index hovers within 1 point of its record-low close.”