
Tracking the herd through sentiment indicators
Tracking the herd through sentiment indicators

“Men, it has been well said, think in herds; it will be seen that they go mad in herds, while they only recover their senses slowly, one by one.”
– Charles Mackay, Extraordinary Popular Delusions and the Madness of Crowds
One of the more fascinating elements of market analysis is sentiment or the behavior of the crowd and its impact on the market cycle.
According to the efficient market theory, it is impossible to “beat the market.” The efficiency of the market causes existing share prices to incorporate and reflect all relevant information as soon as that information becomes known. There’s no room for pricing inefficiencies that an investor might exploit.
There is a tremendous appeal to the efficient market theory. It’s logical and doesn’t demand much from us as investors, because it clearly says there is little we can do other than ride the market.
The problem is that according to the theory, market bubbles—that is, inefficiencies—should not occur. But they do. While there have been market crashes due to external factors, such as the outbreak of war, bubble markets by and large are driven by emotions. Emotions are messy. They are hard to calculate, hard to predict, and inconsistent. And they matter.
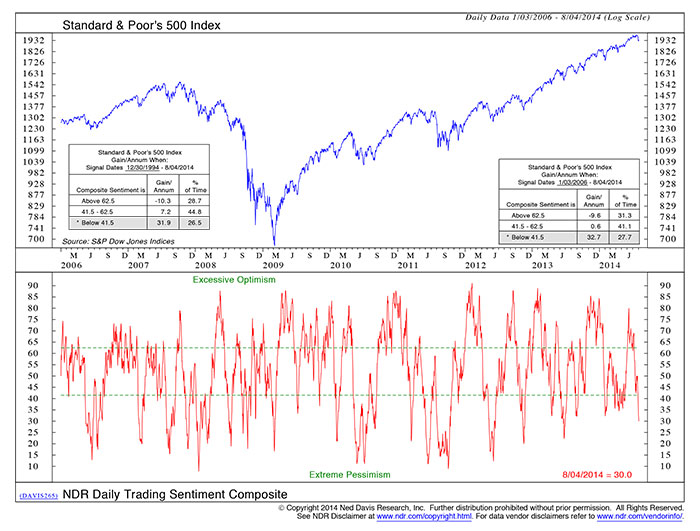
Standard & Poor’s 500 Index, and NDR Daily Trading Sentiment Composite
The quote above is from the preface of the 1852 edition of “Extraordinary Popular Delusions and the Madness of Crowds,” originally published in 1841. The author, Charles Mackay, chronicles some of the most extraordinary market bubbles of history, including the Mississippi Scheme, the South Sea Bubble, and “Tulip Mania,” along with other manias from fads to national delusions. Look closely and their resemblance to modern times is striking. Something happens when crowd sentiment moves toward the extremes. Markets cease to react logically to information and become part of the stampeding herd.
The chart from Ned Davis Research (NDR) shows the relationship of sentiment to market gains and losses. When sentiment reaches an extreme, based on historical analysis of financial markets, a change in market direction typically follows.
And that presents investors with a challenge.
When the manager knows market sentiment is not in extreme territory, there may be more room to tolerate volatility.
(1) If the investor believes overoptimism is fueling the market’s rise, does he step out of the market until the froth has settled with the goal of buying back in at the subsequent bottom, or does he participate with the goal of cashing out when the market shows signs of reversing?
(2) How does an investor know when the end may be in sight?
There are numerous mathematical indicators from overbought/oversold to pattern recognition, cycle analysis, and more that are used to determine when the market is overvalued or undervalued. They are logical, objective, and measureable tools for establishing buy and sell signals. But using these indicators as a buy or sell signal has a major vulnerability summed up very well by the statement, “The market can remain illogical longer than you or I can remain solvent.”
Sentiment is a way to approach the illogical aspects of market volatility. Sentiment is a contrarian indicator. When sentiment reaches an extreme, it typically indicates a turning point is at hand.
Sentiment indicators are often used to adjust the sensitivity of an active management buy or sell signal. The challenge of active management is accurately determining a change in the market’s direction as early in the cycle as possible. Make the wrong call and a whipsaw trade may occur. Move too slowly and the manager could miss participating in market gains or ride a decline down. When the manager knows market sentiment is not in extreme territory, there may be more room to tolerate volatility. At extreme sentiment levels, more hair-trigger trading signals may be appropriate.
Some of the more common sentiment indicators are produced from consumer and investor surveys, such as the University of Michigan and Conference Board consumer confidence surveys or the American Association of Individual Investors survey. By the simple nature of the survey process, their results tend to lag current sentiment levels and are also vulnerable to the fact that respondents sometimes answer the way they believe the interviewer wants to hear or the way they think others may respond.
To overcome the lag time and potential bias of the survey methodology, analysts look for ways to confirm investor sentiment by the actions of investors. Market breadth is one such tool. Market breadth compares the number of companies advancing in price relative to the number declining. When more companies are rising in value, sentiment is bullish.
“Asset price bubbles and crashes are here to stay. They appear to be a consequence of human nature.”
– John C. Williams, President, Federal Reserve Bank of San Francisco, September 9, 2013.
Money flows in and out of stocks, put-call ratios, volatility, momentum, and other technical factors are also considered indicators of investor sentiment. In the chart above, NDR combines a number of technical indicators to create its Daily Trading Sentiment Composite. These are often complemented by the NDR Crowd Sentiment Poll, which is a more subjective tool.
The key to using these indicators is to understand that sentiment has historically only worked as an indicator at the real extremes. The investor needs to know more than just whether the market is bullish or bearish, but whether sentiment is increasing, at what rate, and how this compares to prior market turning points. And then there’s the matter of the black swans—unexpected events that suddenly change market dynamics.
There is also the perspective that historical works such as Mackay’s are not a reflection of modern thought processes or available information. Does the crowd mentality carry the same power today? Certainly many economists and experienced market observers think so.
While active management strives to be an objective approach based on mathematical models to generate buy and sell decisions that can be replicated consistently over time, it must also accommodate the illogical aspects of the market as well. Sentiment indicators are one means of fine-tuning the active management model to take into account human nature.
The opinions expressed in this article are those of the author and do not necessarily represent the views of Proactive Advisor Magazine. These opinions are presented for educational purposes only.
 Linda Ferentchak is the president of Financial Communications Associates. Ms. Ferentchak has worked in financial industry communications since 1979 and has an extensive background in investment and money-management philosophies and strategies. She is a member of the Business Marketing Association and holds the APR accreditation from the Public Relations Society of America. Her work has received numerous awards, including the American Marketing Association’s Gold Peak award. activemanagersresource.com