

The Q2 2018 earnings season is largely drawing to a close this week for major reporting companies, with results in from 91% of the S&P 500 as of Aug. 10.
FactSet notes the following highlights from the earnings season so far:
- “79% of S&P 500 companies have reported a positive EPS [earnings per share] surprise and 72% have reported a positive sales surprise. … In aggregate, companies are reporting earnings that are 5.0% above the estimates, which is above the 5-year average. … Companies are reporting sales that are 1.3% above estimates, which is also above the 5-year average.
- “The blended earnings growth rate for the S&P 500 is 24.6%. If this rate holds up, it will mark the second highest earnings growth since Q3 2010 (34.1%). The blended sales growth rate for the S&P 500 for Q2 2018 is 9.9%.
- “For Q3 2018, 55 S&P 500 companies have issued negative EPS guidance and 19 S&P 500 companies have issued positive EPS guidance.
- “The forward 12-month P/E ratio for the S&P 500 is 16.6. This P/E ratio is above the 5-year average (16.2) and above the 10-year average (14.4)” (Figure 1).
FIGURE 1: S&P 500—CHANGE IN FORWARD 12-MONTH EPS VS. PRICE
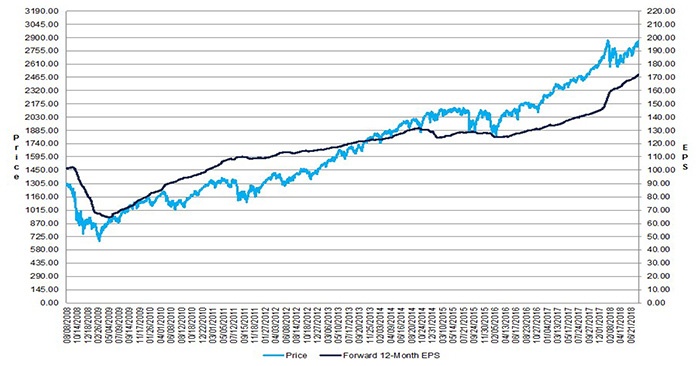
Source: FactSet
Bespoke Investment Group looked at all U.S. companies reporting to date for Q2 2018 and found that,
“While the pace of EPS and revenue beat rates has moderated throughout earnings season, roughly two-thirds of all U.S. companies’ reports have exceeded EPS (65.6%) and revenue (67.5%) estimates this earnings season. While these are strong results, they weren’t enough to avoid a second straight earnings season of sequential declines in either the EPS or revenue beat rates” (Figure 2 and Figure 3).
FIGURE 2: % OF COMPANIES BEATING EARNINGS ESTIMATES BY QUARTER
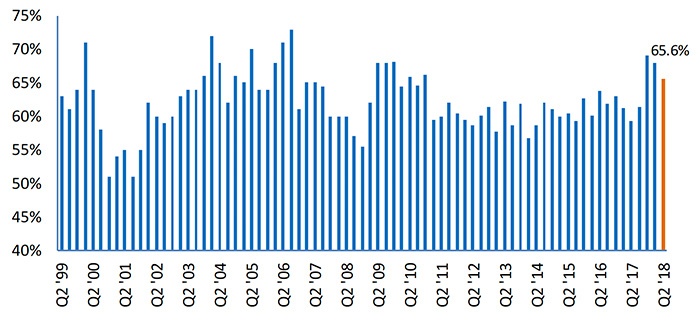
Source: Bespoke Investment Group
FIGURE 3: % OF COMPANIES BEATING REVENUE ESTIMATES BY QUARTER
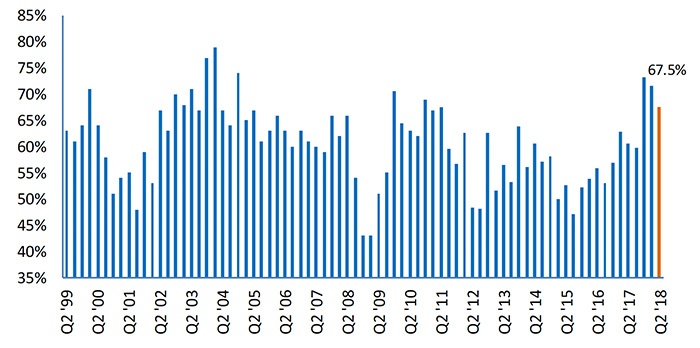
Source: Bespoke Investment Group
Bespoke also noted that nearly a third of companies mentioned the impact of tariffs in their Q2 earnings conference calls. They say, “Sectors where the topic came up the most were Industrials (56.5%), Materials (54.2%), and Consumer Staples (50.0%). All three of these sectors have a lot of international exposure, so it only makes sense that tariffs and trade were a bigger issue for them.”
TABLE 1: MENTION OF TARIFFS IN EARNINGS CALLS
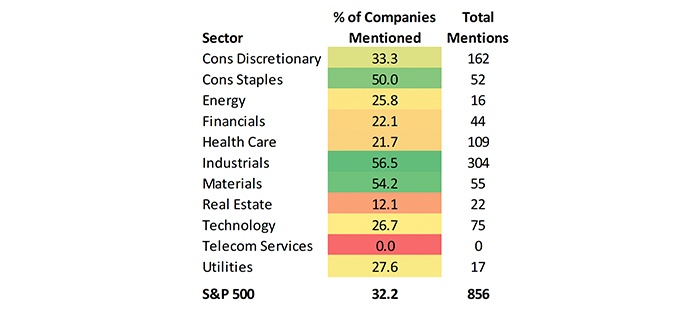
Source: Bespoke Investment Group
What were the impacts of tariffs and other global concerns on actual company earnings and revenues?
FactSet explored this issue by looking at the earnings and revenue performance of companies with greater versus lesser global sales exposure. They concluded that companies with greater global exposure actually outperformed those with lesser exposure in Q2 on both earnings and revenue (Figure 4). However, the nature of the “more global” companies certainly had an impact here, as information technology, energy, and materials companies have the most global exposure and also generally had the best earnings performance of S&P 500 sectors overall (Figure 5).
FIGURE 4: S&P 500 EARNINGS AND REVENUE GROWTH BY GLOBAL EXPOSURE
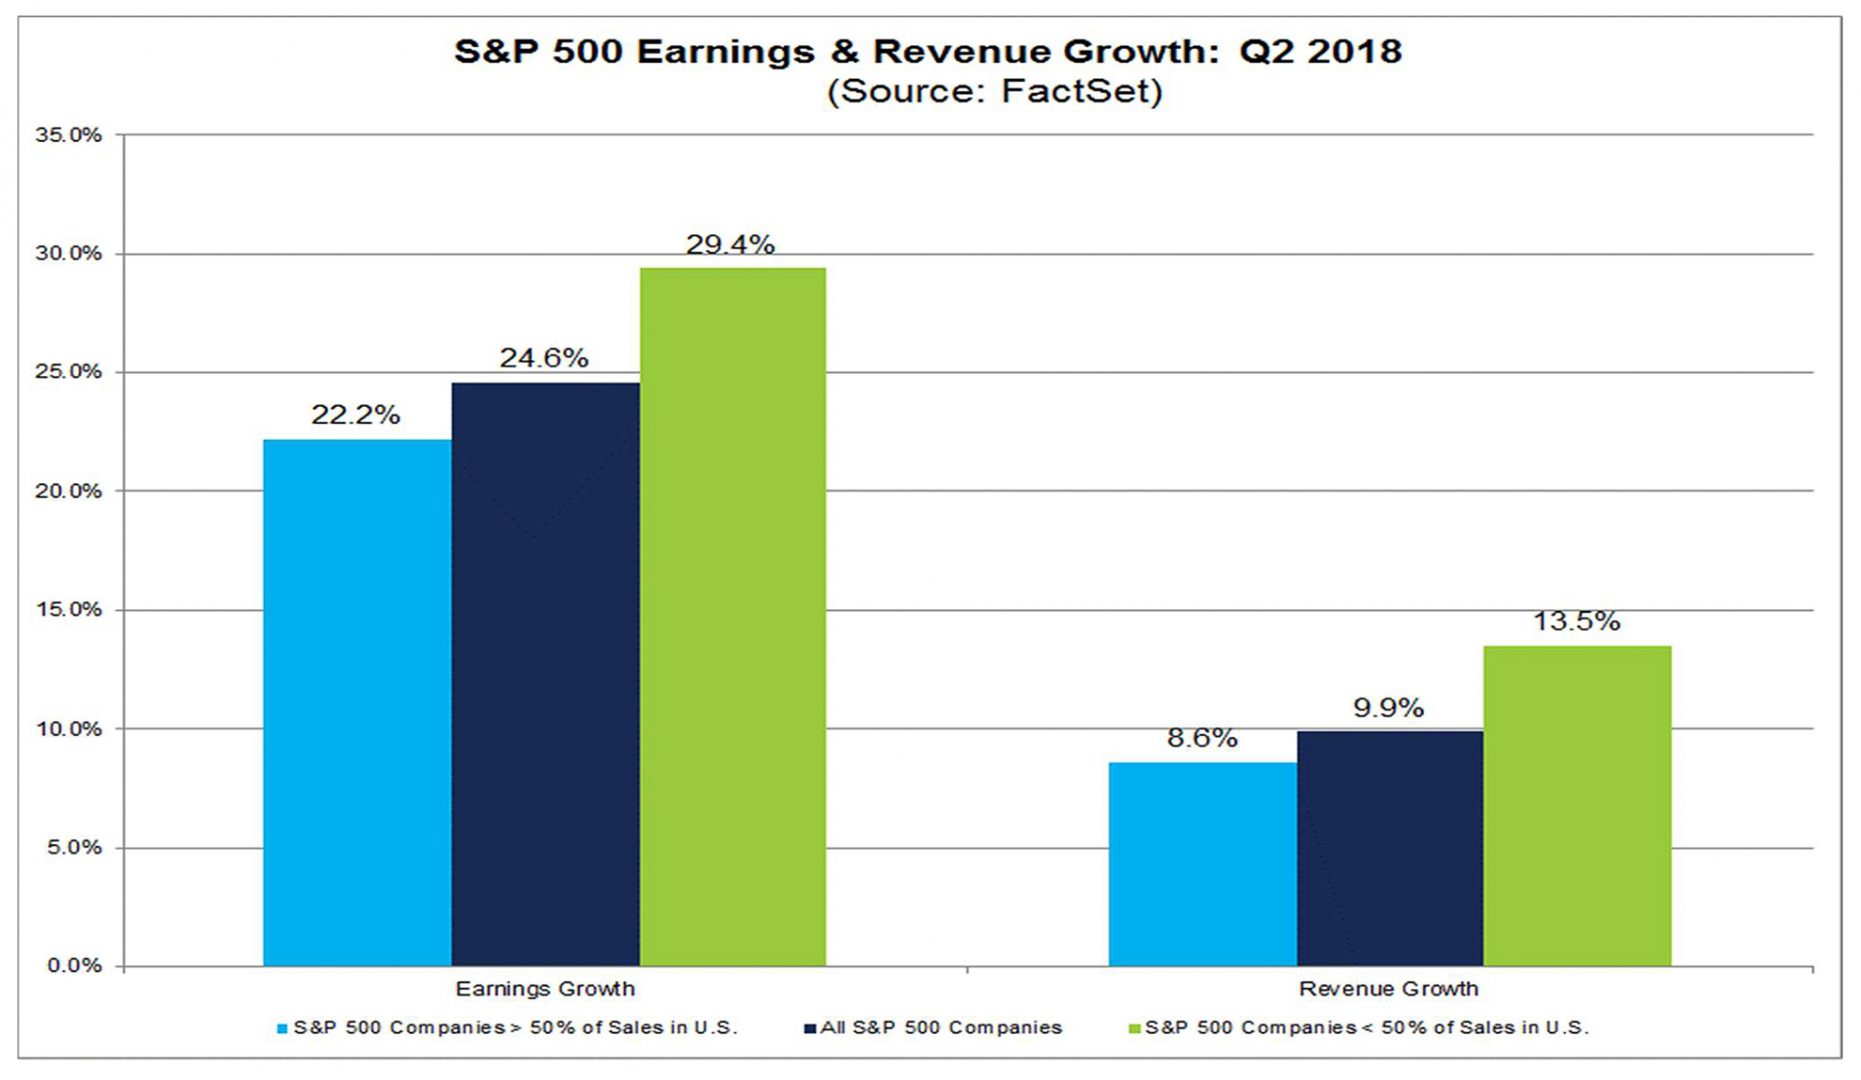
Source: FactSet
FIGURE 5: S&P 500 Q2 EARNINGS GROWTH BY SECTOR
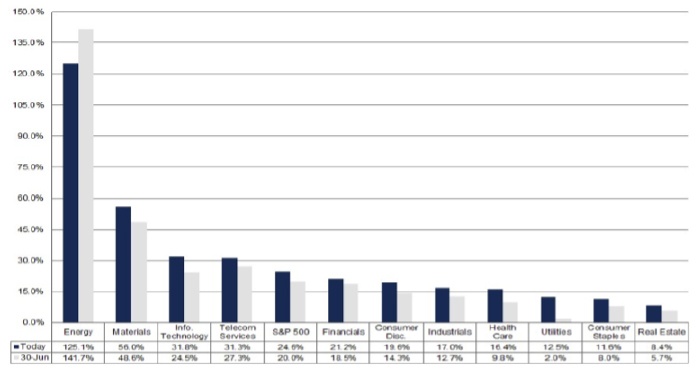
Source: FactSet, data as of 8.10.18