
While October has been known for its volatility and severe market sell-offs over the years (and, ironically, for seeing the start of new bull markets), September has rightfully earned a reputation as the worst-performing month for the market. That held true for September 2021, with last Thursday’s (Sept. 30) sell-off capping a particularly poor month—the worst September since 2011 according to Barron’s.
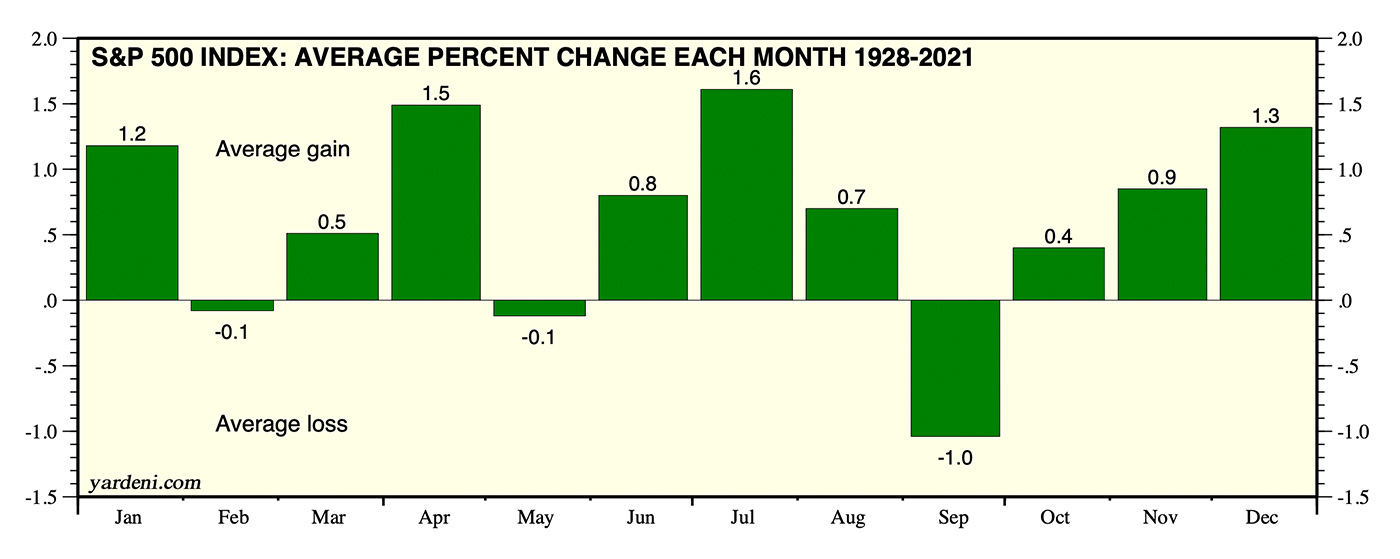
Note: Data through August 2021
Sources: Yardeni Research, Standard & Poor’s, Haver Analytics
CNBC reported the following on September’s 2021 performance:
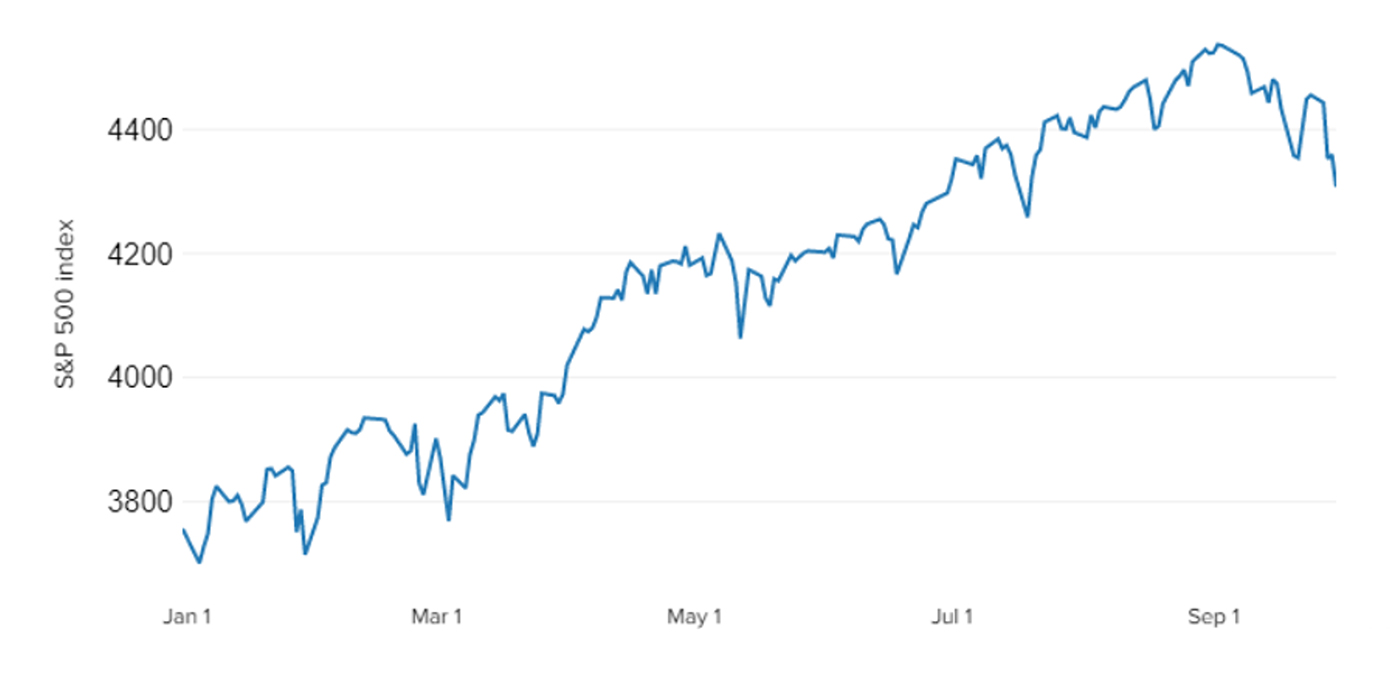
“The weakness for the market came on the final day of what has been a rough month for equities, as rising rates, inflation fears and concerns about the Chinese property market have roiled stocks. The S&P 500 finished September down 4.8% for its worst month since March 2020, when the pandemic caused a major market sell-off. The index also closed 5% below its record high for the first time this year.
“The Nasdaq fell 5.3% for its worst month since March 2020, while the Dow dropped 4.3% for its worst month in 2021. …
“September’s losses led to a weak third quarter for the market. For the 3-month period, the Dow dropped 1.9%, while the Nasdaq Composite shed 0.4%. The S&P 500 held on to a modest gain and is still up nearly 15% on the year.”
Sources: Market data, CNBC
Bespoke Investment Group had the following observations on September and year-to-date market performance by sector:
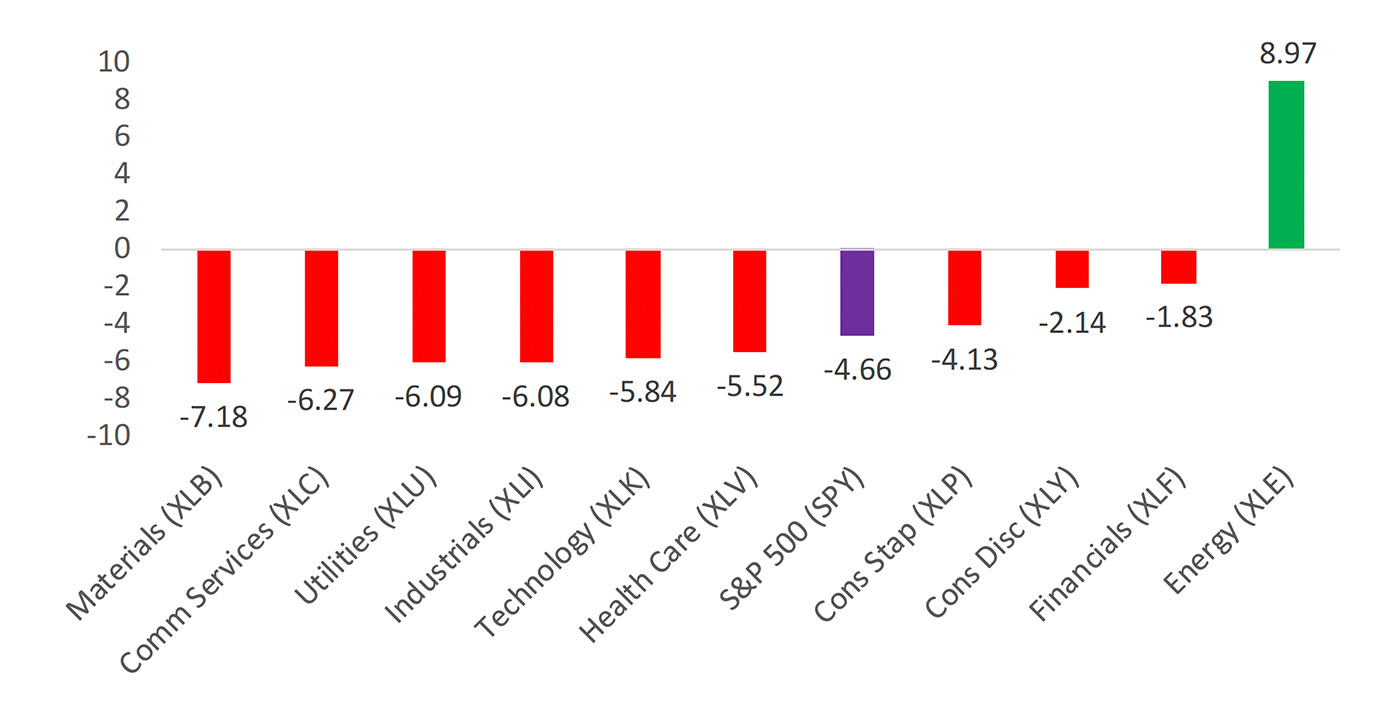
- “The Energy sector (XLE) was the only area of strength in September, but unfortunately the sector now makes up less than 3% of the index. A gain like this back in the mid-aughts when Energy had a weighting above 10% would have actually been felt by the S&P 500 as a whole. Not this time.
- “While Energy was up in September, Materials (XLB) was actually the worst performing sector with a drop of 7.2%. Health Care (XLV), Technology (XLK), Industrials (XLI), Utilities (XLU), and Communication Services (XLC) all underperformed the S&P 500’s (SPY) 4.66% drop in September.
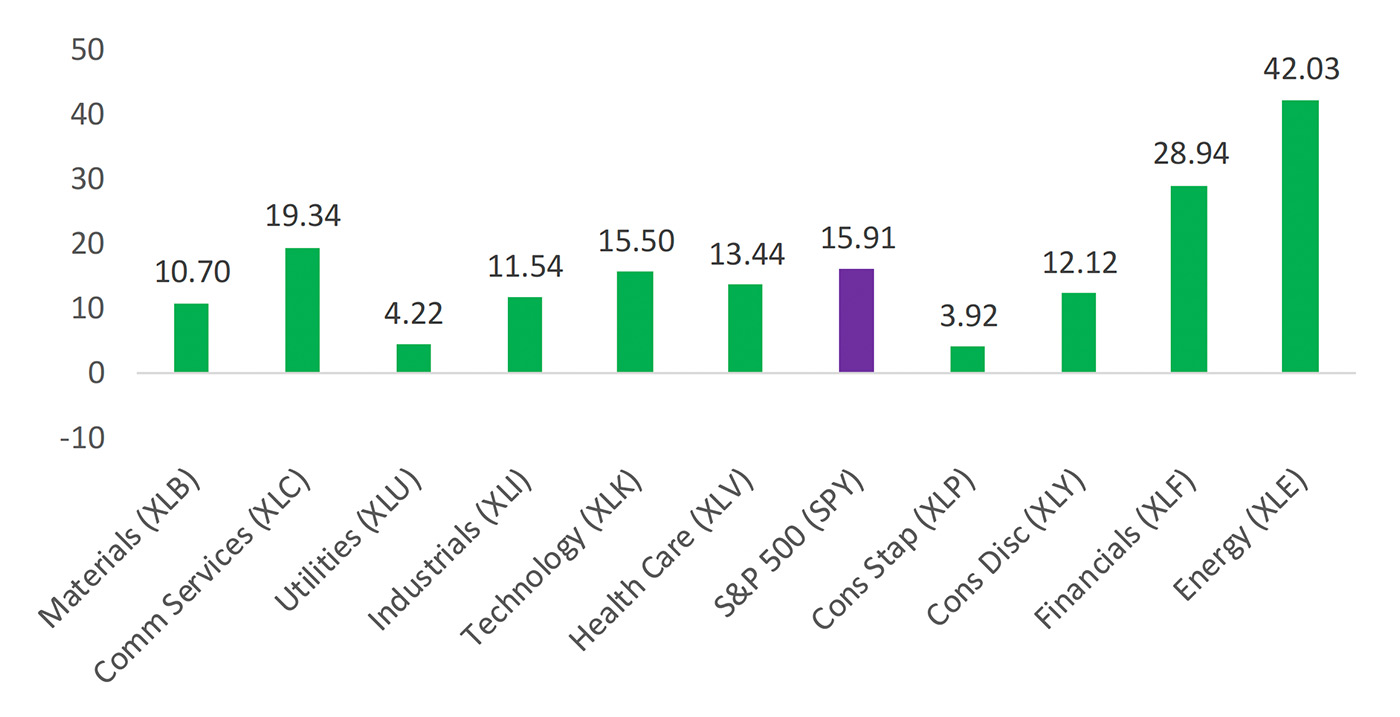
- “Given their outperformance in September, Energy (XLE) and Financials (XLF) remain well ahead of other sectors when it comes to year-to-date gains as well. Prior to September, Energy had given up its YTD lead among sectors, but now it’s back up 42% YTD versus the S&P 500’s gain of 15.9%.
- “Consumer Staples (XLP) and Utilities (XLU) are up the least of the eleven sectors YTD with gains of less than 5%.”
FIGURE 3: S&P 500 SECTOR ETF PERFORMANCE (%)—SEPT. 2021
Source: Bespoke Investment Group
FIGURE 4: S&P 500 SECTOR ETF PERFORMANCE (%)—YTD THROUGH Q3
Source: Bespoke Investment Group
The major market indexes started off the first day of trading in October on a highly positive note, with the Dow up 1.43%, the S&P 500 gaining 1.15%, and the NASDAQ putting in a gain of 0.82%.
Q4 historically represents the best three-month period of the markets. Bespoke notes, “While October hasn’t been the strongest month over the last 100 years, it has still averaged a gain of 0.21%, and then November has averaged +1.28% and December has averaged +1.51%. December has been higher 74% of the time over the last 100 years. The next closest month is July at 65%.”
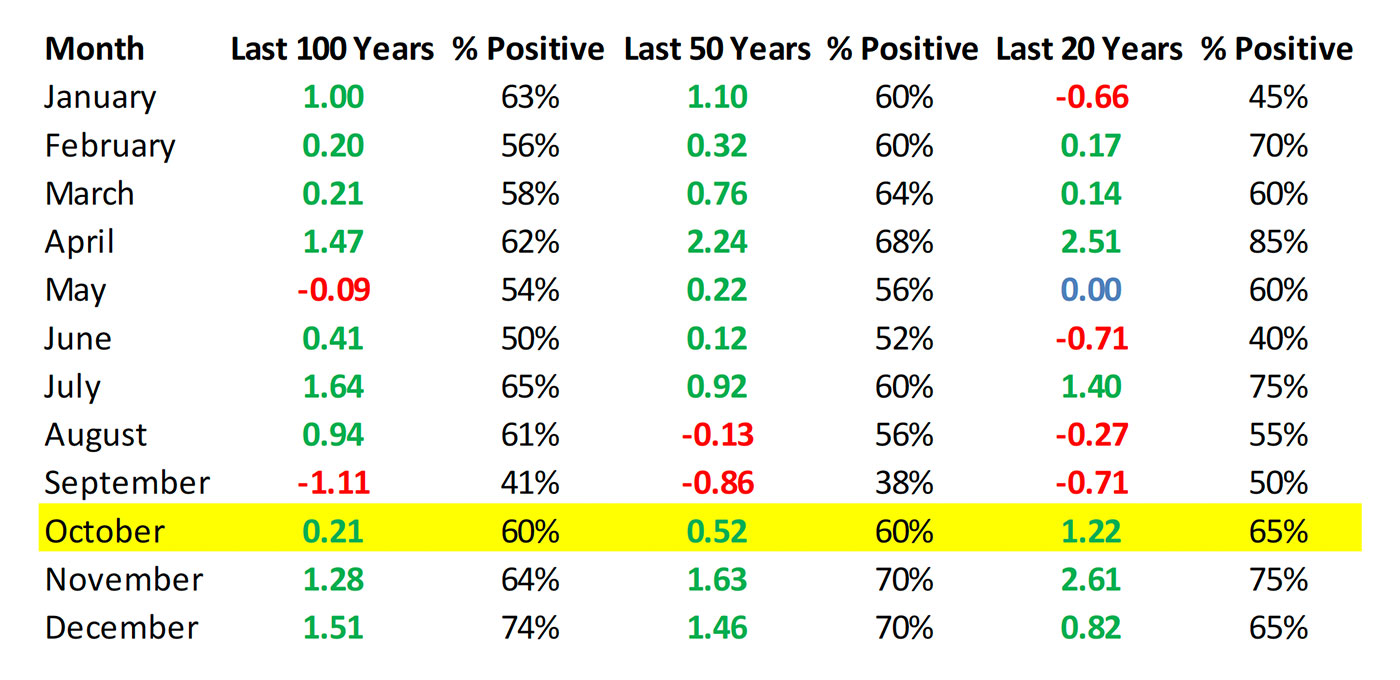
Source: Bespoke Investment Group
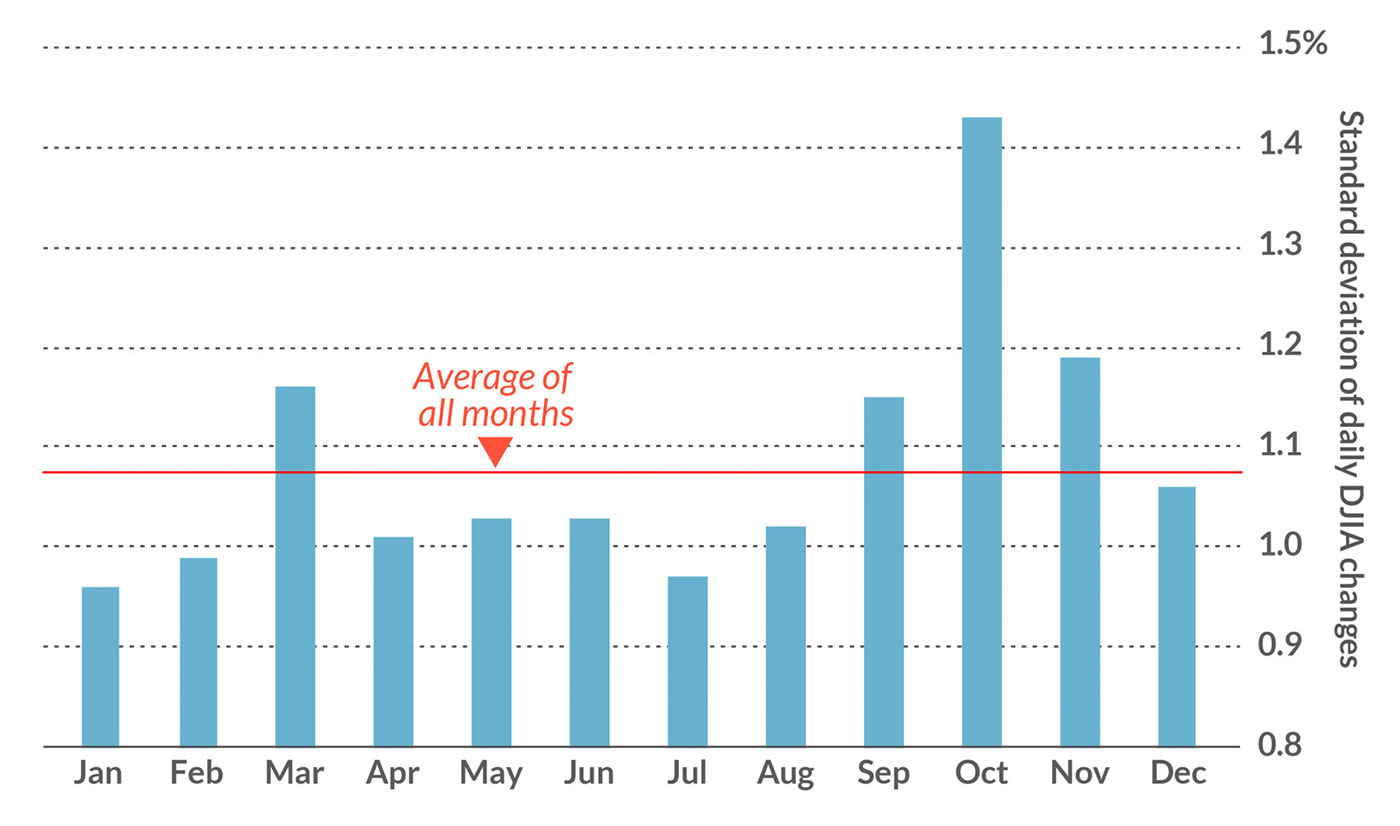
Despite the impressive statistics for the next three months, the challenge for investors in October is weathering the month’s typical volatility.
An analysis from Quantifiable Edges looked at data back to 1985 and found the following:
“October is a month that is known for volatility. And that is a well-earned reputation. Crashes in 1929, 1987, and 2008 all occurred in October. But volatility cuts both ways. If you break the year down into 1-week periods, October also contains some of the strongest seasonal edges of the year. There have been some very big swings in October. … It’s amazing that all 5 potential weeks in October are included in either the Best 10 or the Worst 10 weeks of the year.”
Similarly, LPL Financial has noted,
- “Since 1950, no month has had more 1% moves (higher or lower) than October.
- “Since 1928, 6 of the 10 worst single-day drops have taken place in October; however, 3 of the 10 best days ever occurred in October as well.”
Sources: MarketWatch, HulbertRatings.com
