Since this is simply a study, not a tradable strategy, we can define bull and bear market environments any way we want. I decided rather than look at long-term moving averages or other common techniques, I would simply be precise about when and where major rallies and sell-offs occurred. So I defined a major sell-off as any SPY (S&P 500 SPDR ETF) decline that reached 20% or greater. That bear environment would last until SPY began its next move to new highs. Let’s look back to the 1993 inception of SPY that left me with four distinct bear market environments. They were 7/17/98–10/08/98, 3/24/00–10/09/02, 10/09/07–3/09/09, and 4/29/11–10/03/11. The rest of the time between 1993 and 5/21/15 is considered a bull environment. Since 5/21/15, when the SPY topped out, it has not been determined whether the market is in bull or bear mode. By this test’s definition, it will only be known when the SPY either makes a new high or closes down at least 20%.
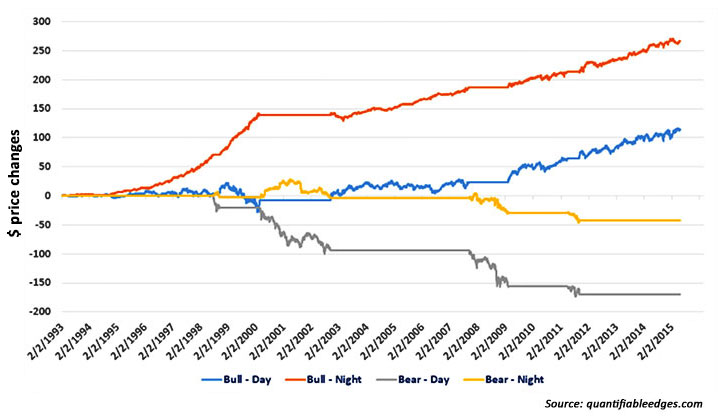
The chart shows positive and negative price changes (not absolute price) for the SPY in four ways: (1) overnight changes during bull runs, (2) intraday changes during bull runs, (3) overnight changes during bear runs, and (4) intraday changes during bear runs.
SPY DAY VS NIGHT IN BULL & BEAR MARKETS

A few things stand out to me when looking at this chart.
Perhaps the most important observation is that most gains during bull markets have come in the overnight session rather than during the day. In fact, it was not until the big bottom in 2009 that bull markets got much of any contribution during the day. This is likely because most of the news that causes market movement happens outside of market hours. This includes earnings, most scheduled government announcements (like the employment report), and possible geopolitical events, which occur on their own timeline. Good news during bull runs will often cause gaps higher, and then that overnight movement is absorbed during the day as institutions adjust their positions. (I want to point out that price changes shown above do not factor in dividends. Dividends would have added another $45.74 to bull market overnight price changes.)
It is also notable that bear markets happen primarily during the day, rather than at night. During bear markets, institutions need to liquidate large amounts of stocks—often because investors are pulling money out of the stock market to place in “safer” havens. Liquidations cannot happen at night when the market is closed. If you want to sell large amounts of stock, it has to be done during the day, and mass selling will cause prices to go down further. So the vast majority of negative price movement in bear markets happens during the day.
It is only after understanding market mechanics like this that traders can create strategies to take advantage of them. Some obvious ways to take advantage of this information would be to (1) utilize long overnight positions during bull markets, and (2) look to earn profits by shorting during the day in bear markets. Of course, one caveat is that it will be helpful to know whether you are in a bull or bear market. But that is a discussion for another day.
 Rob Hanna has worked in the investment industry since 2001. He is the founder and publisher of Quantifiable Edges, a quant-based website where he also publishes a newsletter. After managing a private investment fund through Hanna Capital Management LLC from 2001 to 2019, Rob joined Capital Advisors 360, where he now serves as a registered investment advisor and focuses on short-term and quantitative strategies. quantifiableedges.com
