
One way to beat the market
One way to beat the market

A dynamic, risk-managed investing approach can help minimize the downside in bear markets. That goes a long way toward ‘beating the market’ through full market cycles.
Reading Dr. Edward Thorp’s 1967 book “Beat the Market” in the summer of 1968 changed my life. I had picked the book up as a summer read while home from college. I was intrigued. Years before, I had read a Life magazine account of how Professor Thorp had created the system to beat the dealer at the game of blackjack, or 21.
The method outlined by Thorp in “Beat the Market” used arbitrage (simultaneously buying one asset while selling short another to realize the difference) with stock warrants (rights often issued with stock to make it more attractive to investors by giving the opportunity to gain more shares at a later time at a fixed price).
It turned out that these warrants were often overpriced, and if one sold them short while buying the underlying stock, you could create a “can’t lose” trade that made money whether stocks advanced or declined. Included in the index was a valuation formula that allowed you to calculate what the warrant should actually be selling for at current market conditions.
Since I had just completed my first computer programming course, this was a perfect vehicle to practice my newly acquired skill. Merging computer analytics and the stock market just seemed like a natural fit to me. The rest, so they say, is history. So far, I have spent almost 50 years of my life working on the task.
Of course, the original allure was beating the market. Like in gambling, where the conventional wisdom had been no one could beat the casinos, the accepted academic dogma at that time—and for most of the time since—had been that stock price fluctuations were random, and once you adjusted returns for risk, you could not expect to outperform.

Investing lessons from Dr. Thorp
Professor Thorp, for most of his career, was a little-known giant in the stock market. Yet, today he is known as the “father of quantitative investing.”
I learned at least three lessons from him. He was the first to “invest with an edge.” He has always believed that each investment made should be anchored by an identifiable edge.
Secondly, all of Thorp’s investments were quantifiably derived and managed. They relied solely upon statistics. This meant that they were always objective. It also meant that they were always rules-based, disciplined, and uninfluenced by emotion or opinion.
Finally, Dr. Thorp made me truly aware of risk. Specifically, he made it clear that one had to focus on the risk of an investment, just like the returns.
In 1981, I founded my registered investment advisory firm, Flexible Plan Investments, Ltd., largely focused on these principles. As a result of what I learned from Dr. Edward Thorp, my company has always sought to deliver dynamic, risk-managed strategies to investors.
How to define “beating the market”
What does it mean to “beat the market”? I imagine that most people would say that if you have spent the last five years outperforming some index, like the S&P 500, you have been beating the market. However, if you focus on risk as much as return, that simple comparison might not be enough for you to truly qualify as a “market beater.”
As was clear from Dr. Thorp’s work, risk is important to the discussion. For most investors, beating the market has usually been accompanied by taking more risk than the market. When you adjust the returns for the amount of risk, one often finds that the perceived advantage disappears.
As a general rule, holding just a few stocks, for example, almost always means more risk is being taken. It usually takes at least 14 different issues to constitute enough diversification to get close to the risk level of, say, the S&P 500—and that’s if the 14 issues represent at least the 11 different major sectors of the S&P. Usually, the more focused the portfolio, the less diversified and the more risk.
In addition, market-watchers generally would not award “market beater” status to an investor that simply beat the market when it was going up. Performance over a complete market cycle is the real test. There is no truer test of the actual risk being taken by a portfolio than its performance during a market downturn.
Many market commentators strangely focus on the S&P 500 as a benchmark for portfolio performance and whether you are beating the market. I say “strangely” because I know very few investors that can truly live with the risk actually exhibited by the S&P. It lost roughly 50% during both of the last two bear markets. In my experience, few investors can stick with an investment that falls only 20%! (Of course, the popular NASDAQ 100 cannot even keep up with the S&P when the market falls, as it lost more than 70% in both of those declines.)
FIGURE 1: S&P 500 BULL & BEAR MARKETS AND CORRECTIONS (2000–2009)
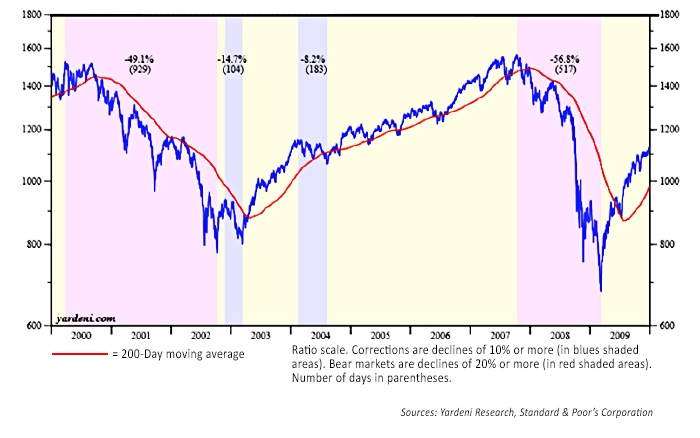
This is especially relevant in today’s market environment. Stocks, as measured by the S&P 500, have been advancing without a 20% correction since March 9, 2009. That is the second-longest bull rally in the S&P 500’s history. Until recently, we had not even had a 5% correction in that Index for about a year and a half. In fact, up until the recent decline, the S&P 500 hadn’t fallen 3% from a previous high point (over one day or several days) since the slump that ended on November 4, 2016, four days prior to the November 2016 election. That stretch was the longest the S&P 500 had ever gone without a 3% or more retreat, according to Bespoke Investment Group.
Yet, many investors believe they have beaten the market with their current one-, three-, or five-year performance. The real test of that claim is yet to come.
Everyone is aware of the great gains in the current rally for tech stocks. However, did you know that the S&P 500 Technology Sector Index took 17 years to finally top its last high-water mark, set in 2000? (The old mark was surpassed in July 2017.)
FIGURE 2: S&P 500 TECHNOLOGY SECTOR (1997–2017)
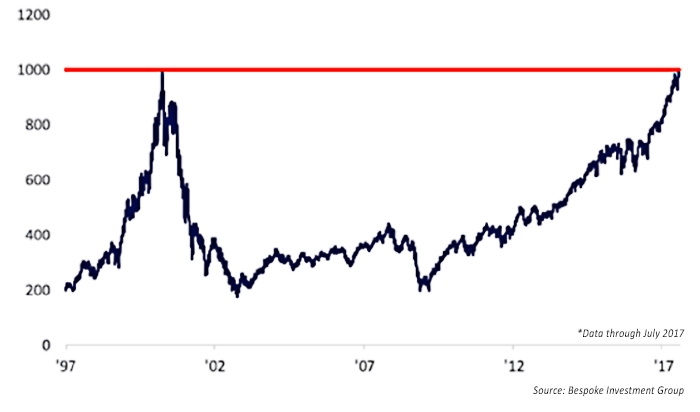
It’s a great lesson. From 1997 to 2000, investors were beating the S&P 500 with tech stocks. Their portfolios soared and were referred to as “market beaters.” Yet, 17 years later, these same investors were just getting back to breakeven. That’s a 17-year rate of return of … zero!
Why did it take 17 years? As Dr. Thorp would say, “It’s just math. It’s quantitative.” Stocks in the S&P Technology Sector Index lost 80% of their value from 2000 to 2003. When you lose 80% of your value, a portfolio must increase 400% to return to breakeven. Even with the best stocks of the Technology sector, it took 17 years to accomplish that feat.
It will probably happen again. The problem is, no one knows when.
Uncertainty and risk are always present
 Uncertainty is always there for an investor in any asset class. All asset classes experience bear markets. No one can precisely pick the tops and the bottoms that will occur in any one of them. However, in a strong bull market period, too many investors tend to lose sight of the continued importance of risk management.
In an article in the Harvard Business Review entitled “3 Reasons You Underestimate Risk,” Srini Pillay, an executive coach and CEO of the NeuroBusiness Group, reports that the reasons for what he calls “risk blindness” are that reward often obscures risk, a failure to properly assess sunk costs, and future aversion. Simply put, this means that we often downplay risks when we are on a long winning streak, too often avoid thinking about losses, and many times are paralyzed by future unknowns.
The suggested ways to avoid these human tendencies are many. However, they can be summarized as simply looking outside one’s narrower perspective and seeking out more possible outcomes. This can often be best accomplished by testing one’s assumptions and the outcome of different scenarios.
This is exactly what quantitative analysis is all about. It attempts to test various factors present in the environment or that are anticipated to determine the best action in different economic times.
To deal with the uncertainty of risk, we have adopted an approach that consists of strategies with the following characteristics:
- They are actively risk-managed.
- Each has a quantifiable, identifiable edge.
- Each is implemented in a disciplined, rules-based, computer-driven manner.
Keeping an eye on all key indicators through our quantitative strategies is what our dynamic, risk-managed investing approach is all about. Historically, it has helped us minimize the downside in bear markets, and that goes a long way toward “beating the market”—as we define it.
After all, history teaches us that one way to beat the market is simply not to lose what the market loses when the market inevitably declines.
The opinions expressed in this article are those of the author and do not necessarily represent the views of Proactive Advisor Magazine. These opinions are presented for educational purposes only.
 Jerry C. Wagner, founder and president of Flexible Plan Investments, Ltd. (FPI), is a leader in the active investment management industry. Since 1981, FPI has focused on preserving and growing capital through a robust active investment approach combined with risk management. FPI is a turnkey asset management program (TAMP), which means advisors can access and combine many risk-managed strategies within a single account. FPI's fee-based separately managed accounts can provide diversified portfolios of actively managed strategies within equity, debt, and alternative asset classes on an array of different platforms. flexibleplan.com