
Is modern portfolio theory seriously flawed?
Is modern portfolio theory seriously flawed?

According to modern portfolio theory (MPT), investors are risk-averse: They are willing to accept more risk only for potentially higher payoffs, and will accept lower returns for a less volatile investment. It’s an extraordinarily elegant theory that has an outsized influence on the investment-management field. But, it is seriously flawed by its method for determining risk.
Simply, MPT is a theory on how risk-averse investors can construct portfolios to optimize or maximize expected return based on a given level of market risk, emphasizing that risk is an inherent part of higher reward.
When Harry Markowitz developed MPT back in the 1950s, he needed a definition of risk and chose to use volatility. The greater the volatility of the portfolio, measured either in terms of standard deviation or beta, the greater the assumed risk. Both standard deviation and beta have the failing of considering upward volatility to be as much a negative as downward volatility.
But there’s another dark side to standard deviation that is too often overlooked: It is based upon a statistical tool known as the bell curve. Assuming that investment returns follow a normal distribution, you can identify the population average and, using standard deviation, determine the likelihood of future returns varying from that average.
Bell Curve
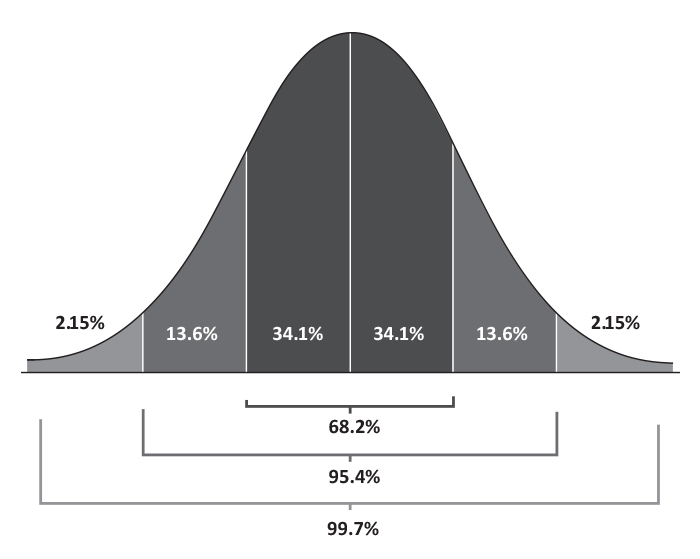
With a normal bell-curve distribution, the highest point in the curve, or the top of the bell, represents the most probable event, with all possible occurrences equally distributed around the top: 68.2% of the returns will be within one standard deviation from the mean; 95.4% of the returns are within two standard deviations; and 99.7% will lie within three standard deviations.
Using standard deviation and historical stock price information, many investment consultants develop portfolios for clients based on the probability of achieving specific returns. But these plans have a flaw that only becomes apparent when it’s too late: they overlook “fat tails.”
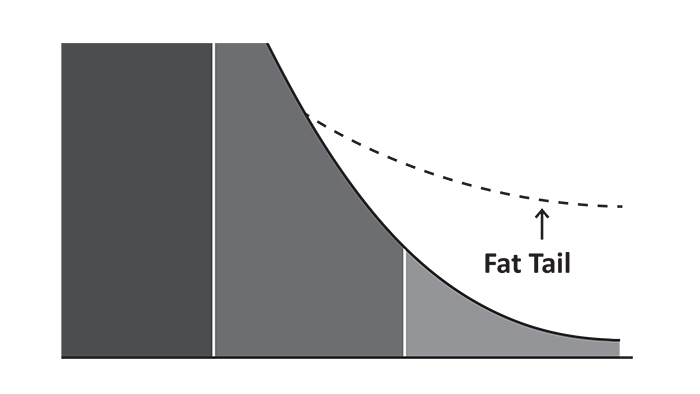
Fat tails are those extreme values that fall outside the normal distribution of the bell curve: far to the left (huge losses) and far to the right (huge gains) of the average. Statistically, they have an extremely low probability of occurring, often less than 0.1%. But they do happen, and with far more frequency than the normal bell curve predicts.
Fat Tails
In his book, “The (mis)Behavior of Markets,” Benoit Mandelbrot studied the period from 1916 to 2003, comparing conventional finance theory, based on the normal distribution of the bell curve, to reality. Statistically speaking, between 1916 and 2003, there should have been only 58 days when the Dow (DJIA) moved more than 3.4%. In fact, there were 1,001. There should have been only six days with swings in excess of 4.5%; there were actually 366. Swings of more than 7% should come only once every 300,000 years based on a bell-curve distribution, but there were 48 such days in the 87 years.
In August of 1998 alone, the Dow recorded losses of 3.5%, 4.4%, and 6.8%. The statistical odds of getting three such declines in one month? 1 in 500 billion.
Recognizing that fat tails do occur, there has been an attempt to modify the standard bell curve to give greater probability to market extremes. But this still leaves a perhaps even bigger flaw to the use of volatility as a measure of risk. For volatility to be a reasonable measure of risk, it needs to have some correlation to return. And therein lies the problem.
The level of volatility in stock prices and index values appears to have little relationship to return. MPT’s measurement of risk is flawed.
In 1977, the Journal of Portfolio Management published an article by J. Michael Murphy, “Efficient Markets, Index Funds, Illusion, and Reality.” In the article, the author cited four studies that found “realized returns appear to be higher than expected for low-risk securities and lower than expected for high-risk securities … or that the [risk-reward] relationship was far weaker than expected.” The author continued: “Other important studies have concluded that there is not necessarily any stable relationship between risk and return; that there often may be virtually no relationship between return achieved and risk taken.”
In 1992, Eugene Fama, one of the original developers of the efficient market hypothesis, co-authored a paper titled “The Cross-Section of Expected Stock Returns,” published in the Journal of Finance. The paper examined 9,500 stocks between 1963 and 1990, concluding that a stock’s risk, measured by beta (i.e., volatility), was not a reliable predictor of performance. “What we are saying is that over the last 50 years, knowing the volatility of an equity doesn’t tell you much about the stock’s return.”
To be predictive, volatility needs to remain somewhat stable. As any market analyst knows, volatility can change dramatically in a relatively short period for reasons unrelated to return. Ben Graham, hailed by many as “the father of value investing,” argued against measures of risk based upon past prices (such as volatility) in his 1934 book “Security Analysis,” noting that price declines can be temporary and not reflective of a company’s true value.
So where does this leave today’s investment advisor? Number one is to realize that MPT and its companion theory, the capital asset pricing model, are not risk-management approaches. While there is value to their focus on diversification, diversification alone cannot protect against market declines.
“If something happens that history has not anticipated, Modern Portfolio Theory breaks down.”
Second is that volatility as a measure of risk is not a predictor of return. Investing in high-volatility stocks with the expectation of high returns is based on faulty assumptions.
And investing in low-volatility stocks is not a foolproof method to avoid significant downward price moves during an overall market meltdown.
Many current market strategists recognize the profound issues surrounding fat-tail or black-swan events. According to Steven Sears, a Barron’s senior editor, “The black swan always hovers over the market’s horizon. … Wall Street’s most accomplished practitioners see a future filled with tail risk. If something happens that history has not anticipated, Modern Portfolio Theory breaks down.”
It is clear that managing risk and return in today’s global investment environment requires active investment management. There are no easy “invest and walk away” solutions.
The opinions expressed in this article are those of the author and do not necessarily represent the views of Proactive Advisor Magazine. These opinions are presented for educational purposes only.
 Linda Ferentchak is the president of Financial Communications Associates. Ms. Ferentchak has worked in financial industry communications since 1979 and has an extensive background in investment and money-management philosophies and strategies. She is a member of the Business Marketing Association and holds the APR accreditation from the Public Relations Society of America. Her work has received numerous awards, including the American Marketing Association’s Gold Peak award. activemanagersresource.com