MarketWatch reported at the end of September, “The S&P 500 has turned in a positive performance for eight straight quarters, meaning the last negative quarter occurred in the third quarter of 2015—and it has risen by nearly a third over that period.”
As earnings season comes to center stage, and forward-looking earnings projections for the next several quarters remain optimistic, can this streak of quarterly wins be extended for U.S. markets?
Aside from the ongoing bearish arguments regarding uncertainty over Washington policy, potential interest-rate hikes, and various forms of geopolitical risk, the one hard factor arguing for a market slowdown rests in the case for stretched valuations.
What does this look like?
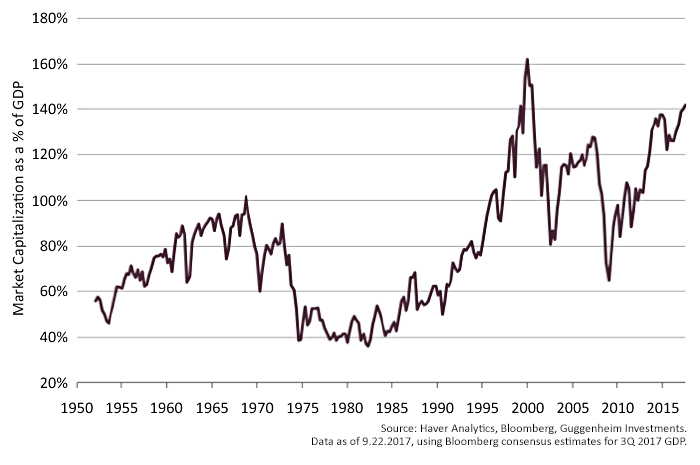
According to a recent paper by Guggenheim Investments, “Total U.S. stock market capitalization as a percentage of gross domestic product (market cap to GDP) currently stands at 142 percent. This level is near all-time highs, greater than the 2006–2007 peak and surpassed only by the internet bubble period of 1999–2000.”
FIGURE 1: U.S. EQUITY VALUATIONS APPROACHING HISTORIC HIGHS

Guggenheim’s paper also notes:
“Valuation is a poor timing tool. After all, markets that are overvalued and become even more overvalued are called bull markets. Over a relatively long time horizon, however, valuation has been an excellent predictor of future performance. Our analysis shows that based on current valuations, U.S. equity investors are likely to be disappointed after the next 10 years. While the equity market could continue to perform in the short run, over the long run better relative value will likely be found in fixed income and non-U.S. equities.”
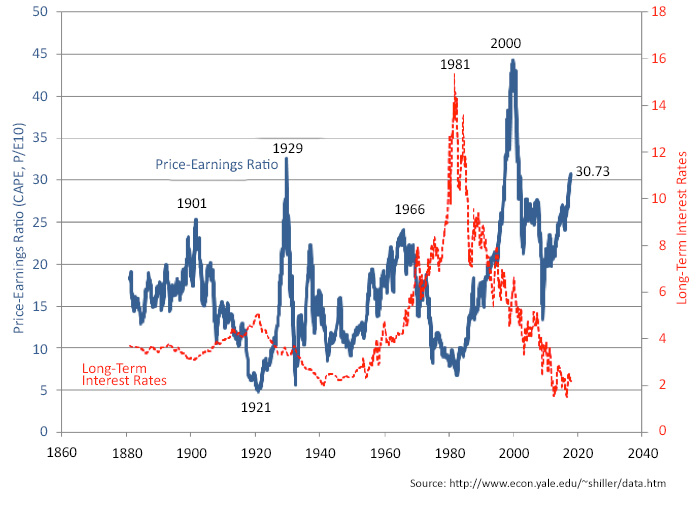
Another perspective on equity valuations is provided by what is known as the Shiller P/E, or Shiller CAPE ratio (the cyclically adjusted price-to-earnings ratio). According to GuruFocus, “The Schiller P/E is a more reasonable market valuation indicator than the P/E ratio because it eliminates fluctuation of the ratio caused by the variation of profit margins during business cycles. This is similar to market valuation based on the ratio of total market cap over GDP, where the variation of profit margins does not play a role either.” GuruFocus notes that the current Shiller P/E is 84.5% higher than the historical mean of 16.8.
FIGURE 2: SHILLER P/E (CAPE RATIO) VS. LONG-TERM INTEREST RATES

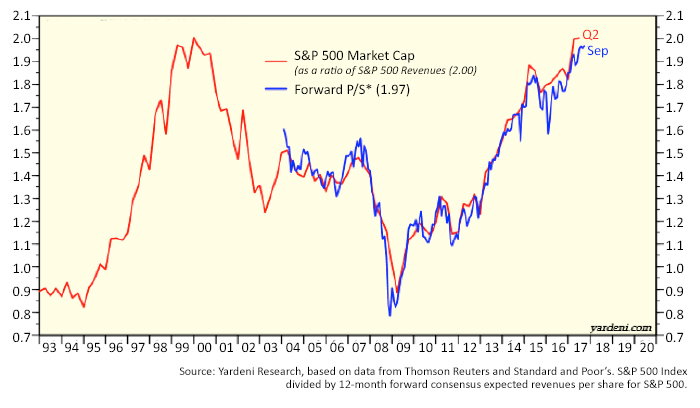
A third measurement of valuations is found in the S&P 500 price-to-sales ratio, where total valuation of the S&P 500 is compared to the combined revenues of the underlying component stocks. The author of an article from Sowell Management recently commented, “I’m not sure there is much more that needs to be said here as the only time stocks were more overvalued since 1955 was during the technology bubble period.”
FIGURE 3: S&P 500 PRICE-TO-SALES RATIO

The bottom line on valuations? While it has certainly been difficult to fight the market’s trend recently—and very little reason to do so—advisors and their clients should be mindful of stretched valuations that will at some point revert to the mean. The questions are simply when does that happen and how fast and hard will the market fall? Periods of seeming complacency–when markets go up in the face of any and all positive and negative news—would seem to be the exact right time for advisors and their clients to be focused on risk management.
