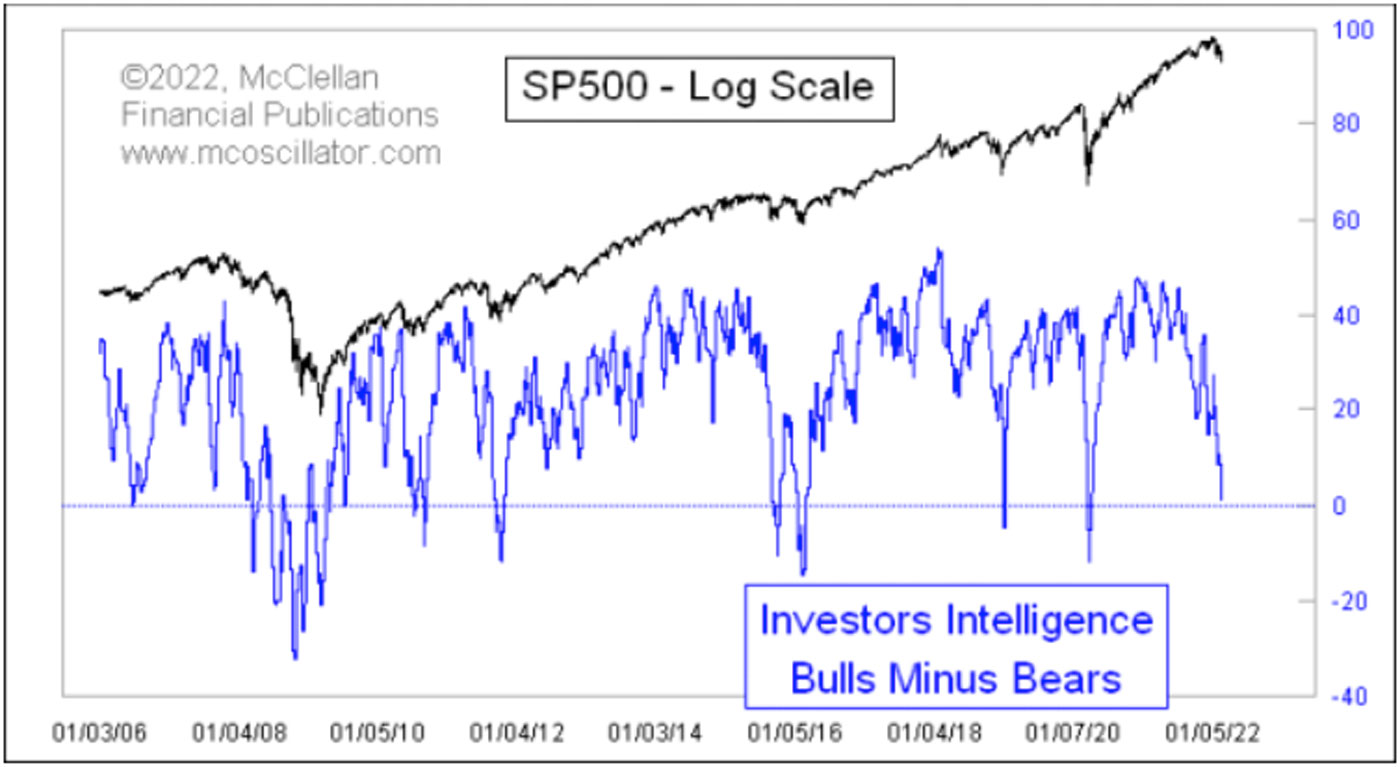

In the latest survey from Investors Intelligence, bulls have fallen to 32.2%, and bears are at 31.0%. That is the lowest bull-bear spread since the COVID crash in March 2020.
This is pretty significant because the average bull-bear spread since 2006 is +24. That is another way of saying that the investment advisors and newsletter writers surveyed by Investors Intelligence are bullish most of the time. And that is appropriate since the stock market goes up most of the time. Or at least that has been true in the past few years.
FIGURE 1: INVESTORS INTELLIGENCE BULL-BEAR SPREAD

Sources: Investors Intelligence, McClellan Financial Publications
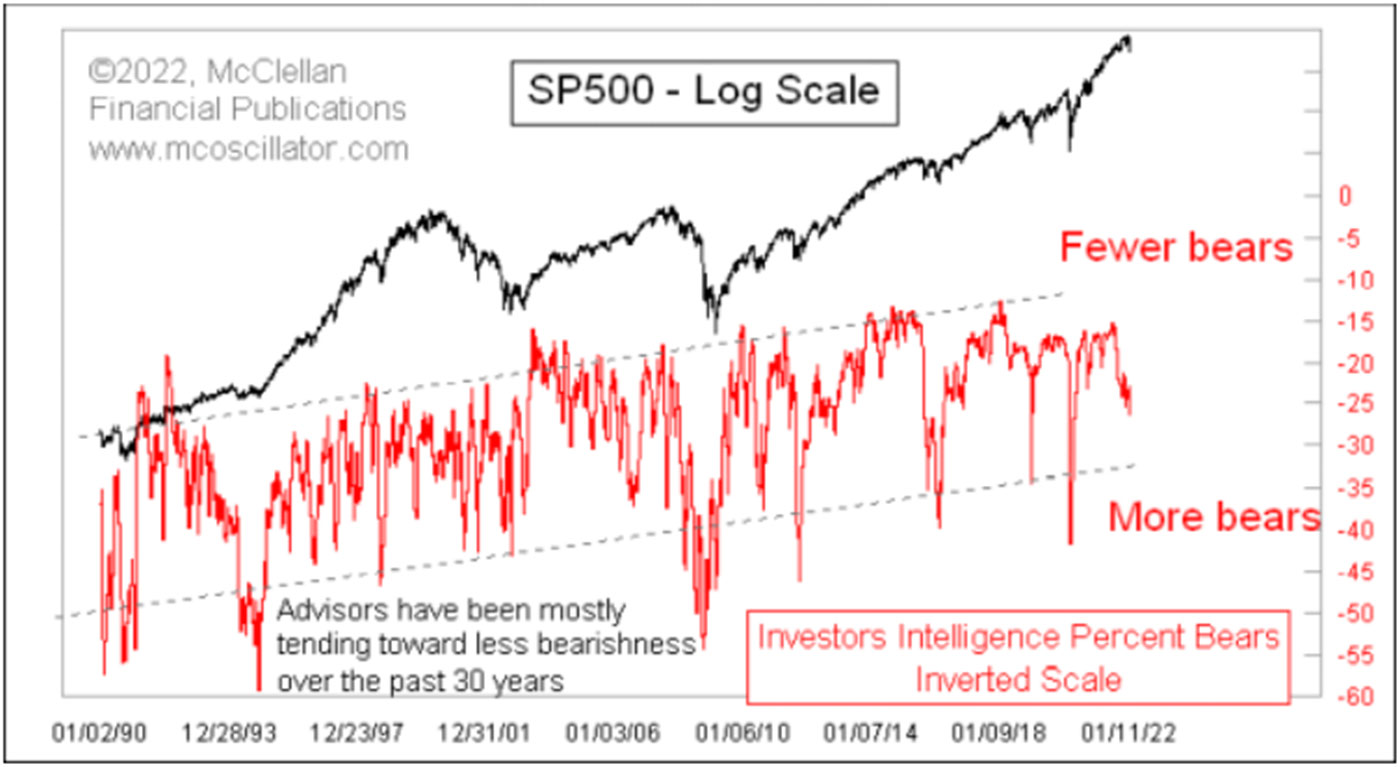
Looking deeper into the data, there have been some changes over time. It used to be that having bears exceed bulls was a frequent occurrence. But over the past few decades, the survey population has been showing a tendency toward less bearishness. Figure 2 presents the data on the bears alone since 1990.
FIGURE 2: INVESTORS INTELLIGENCE—TREND TOWARD LESS BEARISHNESS

Sources: Investors Intelligence, McClellan Financial Publications
Because these data are plotted on an inverted scale (to better correlate to price action), the upward trend actually means a downward trend in bearishness. That is a pretty fascinating development. The Federal Reserve’s actions to prop up the economy and the financial markets since 2009 have resulted over time in people thinking that there is less risk in the stock market. Perhaps one day this long trend will adjust itself.
It is perhaps not a surprise that the recent equalization of bulls and bears has happened as a result of prices falling in a meaningful way. This is an important point—that prices and sentiment are related more than most analysts appreciate. Rising prices get people more bullish. Falling ones get people convinced that more trouble is ahead. Even though this is generally the opposite of how prices actually behave, it is how the human brain behaves.
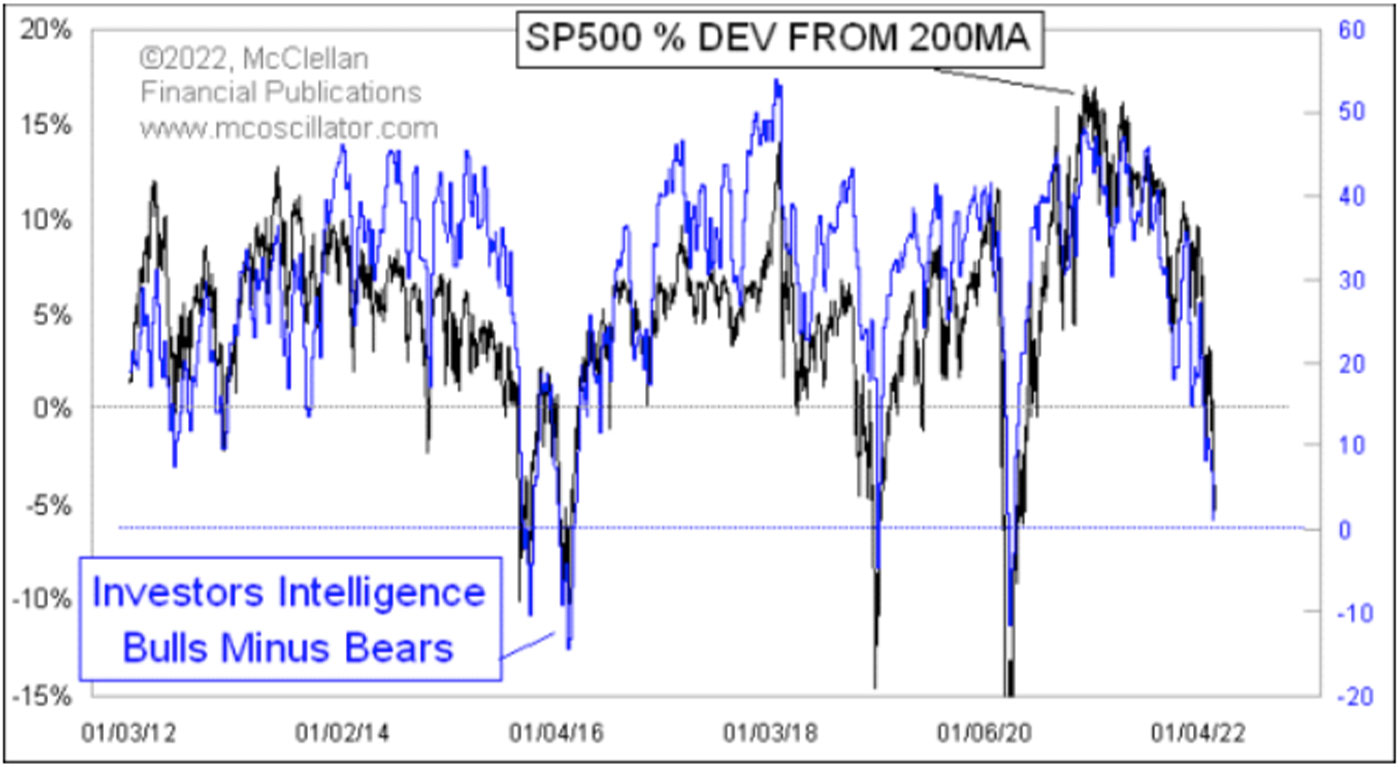
To make the point that prices and sentiment really are the same thing, years ago I sought to make that comparison directly. One problem is that stock prices trend upward over time, whereas the sentiment data are naturally bounded. I solved this problem mathematically by “detrending” the price data. In this case, I plotted the S&P 500 data expressed as a percentage deviation away from its 200-day moving average. That way I could plot it better versus the sentiment data. Figure 3 shows that comparison.
FIGURE 3: THE CORRELATION OF S&P 500 PRICE TO SENTIMENT

Sources: Investors Intelligence, McClellan Financial Publications
The scaling in this chart is adjusted to get the tightest fit possible of the two plots, and doing so reveals the significant bias to the bullish side of the survey respondents. The zero lines for the two plots are not in the same place on the chart. All of these adjustments help us to see the point that changes in price levels help result in changes in sentiment, although not necessarily in a linear fashion, and not exactly uniformly over time.
The change in sentiment thus far in early 2022 is a natural outcome of the change in the price level. So be careful what conclusions you draw from hearing that “bulls versus bears” has done something interesting. It could just be a reflection of the price action.
The opinions expressed in this article are those of the author and do not necessarily represent the views of Proactive Advisor Magazine. These opinions are presented for educational purposes only.
This is an edited version of an article that first appeared at McClellan Financial Publications on Feb. 25, 2022.
New this week:
 Tom McClellan is the editor of The McClellan Market Report newsletter and its companion, Daily Edition. He started that publication in 1995 with his father Sherman McClellan, the co-creator of the McClellan Oscillator, and Tom still has the privilege of working with his father. Tom is a 1982 graduate of West Point, and served 11 years as an Army helicopter pilot before moving to his current career. Tom was named by Timer Digest as the #1 Long-Term Stock Market Timer for both 2011 and 2012. mcoscillator.com
