There are modern tools that make investing easier and more reliable for independent investors managing their own stock portfolios or retirement accounts. These tools incorporate visual graphs using fundamental data, making it far easier to understand how the information is impacting or will impact the stock price.
Most investors would like to have some way of knowing when a stock or the stock market is entering a long bear market phase. They do not want to be short-term traders buying and selling a stock. However, it would be helpful if they could find a method that was reliable to warn when a company or economic business cycle had peaked and that a long period of business contraction was starting, or when a bull market had peaked, warning that one to three years of a bear market was coming.
Bear markets can wipe out as much as 70% of stock market value. Understanding how to avoid losing significant portfolio value is crucial, as stock market cycles are evolving and changing.
Many investors now look back over the past five years and wonder why they didn’t invest in stocks sooner, as they missed out on most of the gains of recent years.
These tools for long-term investors provide visual references that allow the investor to see things in a graphical format. Most fundamentals can now be viewed not only as data on reports, but can also be studied in a graph format that the investor can customize to their particular needs.
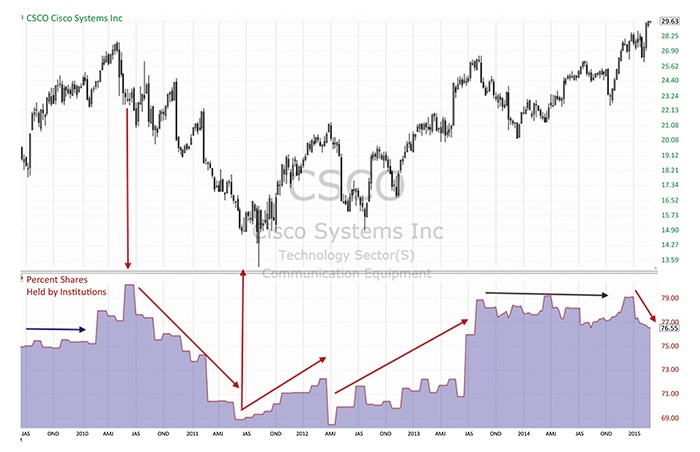
Percent of Shares Held by Institutions (PSHI) is one of these fundamental indicators in a graph, and as with all fundamental indicators the data is pure data. It is not averaged or smoothed, so the graph line will move sharply and at angles.

Source: TechniTrader.com
PSHI is a critical indicator to watch if you are a long-term investor. Since the “Institutions” control about 80% of all of the outstanding shares with $90 trillion in assets worldwide, which stocks they are buying (accumulating) and which stocks they are selling (distributing) matters more than ever.
Investors can avoid bear market losses of huge magnitude by using this and other fundamental indicators to see the patterns developing over time. When a stock is under quiet distribution by the major institutions, its price will slowly decline and is at risk of a major bear market.
The institutional fundamental indicator PSHI is reporting information that is required from all funds by the SEC and FINRA—provided via Nasdaq.com, Reuters.com, and other independent investor websites.
The chart above is Cisco Systems Inc. (NASDAQ: CSCO) with the PSHI indicator in the bottom chart window. Starting on the left side and going across to the right, the indicator graph shows how price is influenced by the number of shares held by the institutions.
In the year 2010, institutional holdings peaked at around 80% of the outstanding shares, and distribution began driving the price down. The bear market for CSCO halted in the summer of 2011, as institutions started buying the stock.
There was some rotation with adjusting of portfolios and then more accumulation. The flat period during the year 2014 was when some of the largest institutions reduced shares, while smaller funds bought shares. Currently the stock is under distribution again, and the stock price is at risk of following if the institutions continue to sell.
The opinions expressed in this article are those of the author and do not necessarily represent the views of Proactive Advisor Magazine. These opinions are presented for educational purposes only.
 Martha Stokes, CMT, is the co-founder and CEO of TechniTrader and a former buy-side technical analyst. Since 1998, she has developed over 40 TechniTrader stock and option courses. She specializes in relational analysis for stocks and options, as well as market condition analysis. An industry speaker and writer, Ms. Stokes is a member of the CMT Association and earned the Chartered Market Technician designation with her thesis, "Cycle Evolution Theory." technitrader.com
Recent Posts:
