
How the market really works
How the market really works

The discounting mechanism of the markets seldom can be underestimated, as future expectations frequently trump current concerns.
A great many investors (professional and amateur alike) follow a similar process when considering how to invest. They start the process with their take on the economy and then go from there. The general consensus is that earnings drive stock prices and the state of the economy drives earnings. Simple, right?
As such, this crowd, along with those viewing the stock market’s glass of water as at least half empty, might be wondering what has been going on in the stock market rally off the August and September lows. The argument I have heard recently is how can stocks be rebounding near all-time highs when, according to the government, the economy grew at a rate of just 1.5% in the third quarter?
The follow-up point is that the Q3 growth rate for the U.S. economy was less than half the rate that was seen in the prior two quarters. “So how on earth can the market be at such lofty levels?” I was asked. “It’s a bubble!” said another. And then a colleague subscribing to this fundamental(ish) approach suggested, “Make no mistake about it, we are in for trouble!”
When I hear this, I just shake my head. It is unfortunate how many investors (again, both professional and amateurs alike) simply don’t have a solid understanding of how the market’s game works.
You have to understand the game
For starters, it is important to understand that from an uber-big-picture, longer-term standpoint, the stock market tends to be a discounter of future expectations—not a mechanism that reacts to what has already happened. And while I run the risk of oversimplifying what can be a very complex subject, the 1.5% GDP number we saw in October probably explains the sloppy, sideways market action during the first eight months of the year. You see, everybody who follows the economic data knew that the GDP number was going to be weak this quarter—and they’ve known this for some time now.
So, one argument for the current move to the upside is that the outlook for both the U.S. and global economy has actually upticked since everyone thought the world was coming to an end in the middle of August. Recall that at the time, China’s economic troubles were beginning to accelerate and the devaluation of the yuan was going to change the economic landscape. Therefore, stocks course-corrected to the downside to adapt to the idea that the future of global growth might be a problem.
How can stocks be rebounding near all-time highs when, according to the government, the economy grew at a rate of just 1.5% in the third quarter?
The key here is the recent realization that if global growth isn’t going to be a problem in the future, then the downside correction in stock prices that was attributable to that concern needed to be “corrected” to the upside. Bam, just like that, the S&P 500 is back to where it was before the worry about global growth began. Why? Because the worry about the future has been largely removed thanks to the efforts of Yellen & Co., the Europeans, the Chinese, and the Japanese.
In addition, if you look deeper, the GDP numbers are really not that bad. According to Brian Wesbury of First Trust, core GDP continues to look pretty solid, growing 3.3% versus last year. He also points out that nominal GDP grew at a 2.9% rate over the last year and is up at a 3.8% rate over the past two years.
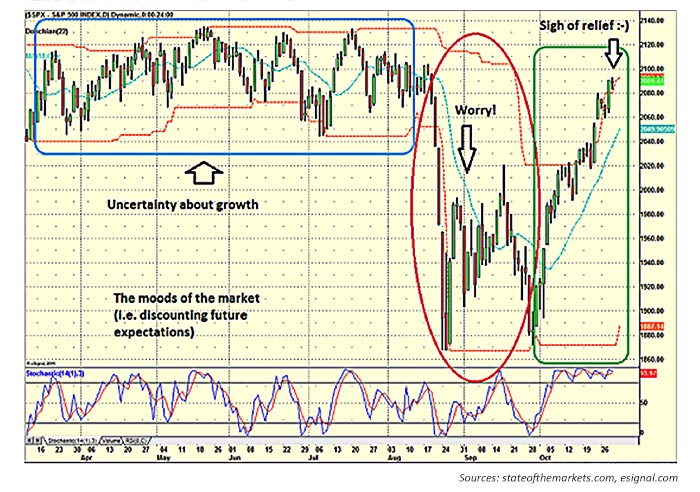
The daily chart of the S&P 500 (Figure 1) provides a graphic example of my take on the drivers—or moods—of the market for much of this year. First, there was uncertainty about the weakening economic picture here in the U.S. Then in August we saw the market “correct” the view that things were simply slowing down a bit. And then for much of October we saw the sigh-of-relief rally in response to (a) Ms. Yellen telling us the economy is doing fine, thank you; (b) the ECB’s decision to continue its QE program; and (c) all of the talk of more stimulus out of both China and Japan.
FIGURE 1: S&P 500 AND ‘MOODS OF THE MARKET’
Show me the money
While the most recent rally led to one of the best Octobers on record, there is a good news/bad news situation relating to the subject of volume on the U.S. stock market.
Volume tends to be the ultimate “show me the money” indicator. Cutting to the chase, the bigger-picture message from some of my favorite volume-based indicators is that despite the fact that the S&P 500 looks like it once again is ready to flirt with all-time highs, the “oomph” one might expect to see from the volume indicators is M.I.A. The good news is that the 30-day average of up versus down volume has turned positive. However, it is not exactly robust in terms of differential and is below levels seen earlier this year.
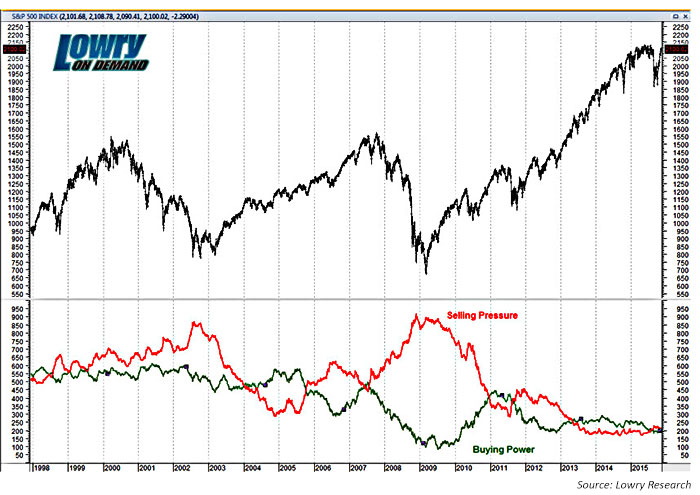
The bad news is that on a longer-term trend line, covering the past 17 years, there are some signs in the volume area that are more troubling. In Figure 2 from Lowry Research, the green line represents “Buying Power,” in a flat to slightly down trend, and the red line is “Selling Pressure,” also in flattish trend. These two lines crossed over fairly recently, but the key point is that the relationship raises some questions about the underlying strength of the bullish price trend. According to Lowry, “These are signs one would expect more from a market top and have been usually coincident over the last 80-plus years of market history with the final stage of a bull market.”
The bottom line
The evidence in Figure 2 tells us that the internal health of the market (at least as far as volume is concerned) is not as strong as we’d like it to be given all the talk of the bulls breaking out to new highs.
FIGURE 2: S&P 500 PRICE TREND VS. SELLING PRESSURE & BUYING POWER (1998-2015)
But, we need to give the bulls the benefit of the doubt here. A model I use that incorporates volume indicators and has an excellent track record continues to have the market on a buy at this time, having issued a sell signal (appropriately) in July 2015. The market’s price action would dictate that it is currently a better time to buy the dips than to sell the rallies.
It is important to realize that the market can generate significant moves based on changes in market mood and future expectations, as we have seen throughout 2015. But we need to keep a very close eye on how supply versus demand volume shakes out over the next weeks and months. There is still some technical volume ground to make up before markets can fully complete the recovery from the August and September swoons.
The opinions expressed in this article are those of the author and do not necessarily represent the views of Proactive Advisor Magazine. These opinions are presented for educational purposes only.
 David D. Moenning is chief investment officer at Sowell Management Services, an independent RIA firm focused on modern portfolio diversification. Mr. Moenning has been a full-time money manager since 1987 and is also the founder of Heritage Capital Research. Mr. Moenning is a former president and chairman of the National Association of Active Investment Managers (NAAIM). heritagecapitalresearch.com