According to Barron’s, pending sales of existing homes slowed significantly in January, down an unexpected 2.5 percent versus consensus estimates for a 0.5 percent gain. However, this was partially offset by a 0.8 percentage point upward revision to December. Sales in January fell in three of four geographic regions, with only the Southern region achieving positive results. Year-on-year, pending sales across the U.S. are up 1.4 percent on average. Barron’s analysis calls this “yet another disappointment for a sector that, despite high employment and low mortgage rates, is getting off to a flat start for 2016.”

The report was something of a surprise, as most empirical and anecdotal evidence points to a relative scarcity in the existing-homes inventory in many areas across the U.S. According to data from the Federal Housing Finance Agency (FHFA) House Price Index, which was released a week ago, home-price appreciation (through December 2015) continues to show a positive trend but slowed down going into the end of the year. The national average price increase for December came in at the low end of the expected range, with a 0.4 percent monthly gain, though posting a year-over-year national increase of 5.7 percent.
Other major housing data points were also released last week, including the S&P Case-Shiller Home Price Indexes. This ongoing series tracks monthly changes in the value of residential real estate in metropolitan regions across the U.S. The composite indexes and the regional indexes measure changes in existing home prices and are based on single-family-home resales.
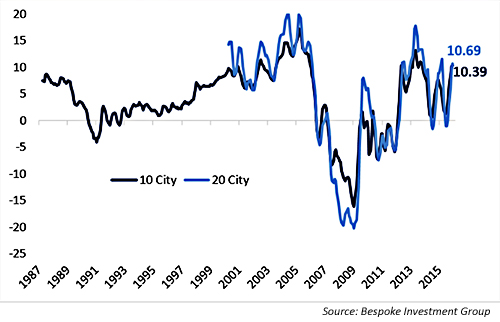
This data continues to be strong, while also showing some weakening going into the end of 2015. Like the FHFA report, annualized price appreciation is running at about 5.7 percent nationally, slightly off the trend that was tracking in the six-percent area. However, Bespoke Investment Group took a positive view of the three-month trend in Q4 2015, saying the following of last week’s report:
Tuesday’s Case-Shiller Home Price Index results showed home prices across the country rose by over 10% (annualized) in Q4 2015, one of the best paces in years. Versus December of 2014, the rate of growth was about half as high thanks to soft prices in the middle of the year. Home prices have not been rising inexorably in the same way as they did for years leading up to the global financial crisis; rather, they’ve been quite volatile, but the overall trend is higher.
Overall, this is healthy, as it represents a normal asset market; home prices rising 10% per year for almost a decade (and accelerating steadily that whole time) don’t represent a healthy balance of supply and demand. The more volatile home prices since the post-recession move up is much more reasonable. One interesting detail in the data: ‘real America’ appears to be clawing back underperformance in home prices versus coastal cities. … Home price appreciation outside major cities is ‘making middle America great again.’”
