All three major indices had their best month since October of 2011, and the S&P 500’s performance joined only 12 other months since 1987 with an increase over 8%. But the Dow Jones Industrial Average topped that at a monthly gain of 8.5%, and, according to CNBC, its 1,379-point increase was a new all-time monthly record.
Numerous analysts have crunched the numbers for how the rest of the year performs after outsized October gains. The consensus seems to be that very strong Octobers steal a little bit of thunder from the “Santa Rally”—although the market usually does see further gains by year-end.
Sam Stovall, chief strategist at S&P Capital IQ, notes that since 1945, the S&P 500 has risen 77% of the time in the year’s final two months, with an average gain of 3%. However, in years with an October gain over 7%, there have been positive November-December periods only 60% of the time, with gains averaging 1.9%.
Interestingly, in Stovall’s mini-study, as October gains increased by each percentage point, there was a corresponding drop in the likelihood of a year-end rally. In fact, the strongest case for a positive last two months comes when October is a down month, with year-end gains occurring 81% of the time.
Mark Hulbert of MarketWatch focused instead on the “Halloween Indicator,” which historically shows the market delivers its best returns in the November-May period. The “Sell in May” pattern worked once again, with the Dow gaining 2.6% last “winter” and then losing 2.6% through Halloween 2015.
His research indicates superior expected returns for the market when major indexes were up on a net basis for the September-October period. The next November-May period then averages a gain of 6.8%, versus an average of 4.0% when September through October is negative.
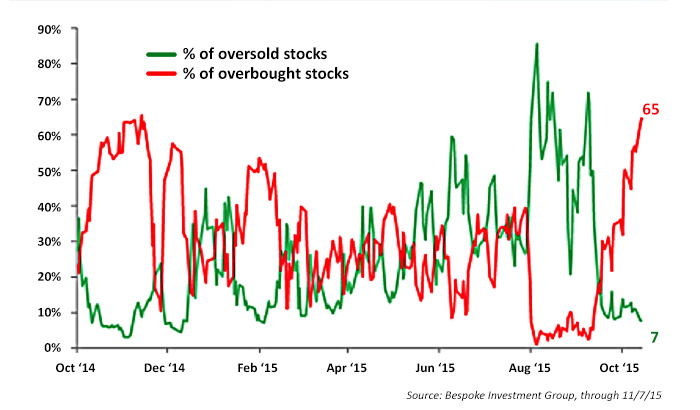
For now, however, markets are dealing with the rapid onset of an “overbought” condition. Bespoke Investment Group notes that the index finished last week with six straight up weeks, bringing the percentage of stocks trading above their 50-DMAs back above the 80% mark for the first time in 2015.
This was coincident with a Bespoke proprietary indicator reaching its highest “overbought” level for the year (see chart). With increased odds now for a December Fed rate hike, “average” year-end performance becomes a more-than-ever questionable barometer.
PERCENTAGE OF OVERBOUGHT AND OVERSOLD STOCKS IN THE S&P 500

