
I was flabbergasted at the events that took place from November 2019 to when I wrote my most recent article for Proactive Advisor Magazine (written in February, published in March). Since that time, I’ve been officially in the camp of “nothing surprises me anymore.” It has been a very strange year indeed.
Regardless of anyone’s opinion or beliefs related to the events since Feb. 27, the behavior of the powers that control our money has made it overtly clear that all forms of manipulation are on the table.
Do we truly have “markets” anymore? Does fundamental analysis have any value anymore?
The classic “cause and effect” adages don’t seem to have predictive value in this new age of limitless money “backed by nothing.”
I know many advisors who believe that things are off-kilter in the markets.
One thing remains consistent: It doesn’t matter if we have true markets or “holographic” ones, there will always be a measurement expressed by price. Price reflects the collective opinion, analysis, and market actions of participants all wrapped up in one single number for every single CUSIP (a nine-digit code that identifies securities).
Modeling and actively managing based on price movements—disregarding the current noise, story lines, and expectations based on past “if A happens—then you can expect B” thinking—seems to have the most value at this point.
In my last article, I discussed relative weakness as a way to reduce volatility and drawdown with the anticipation of COVID messing up the market.
Boy, that was timely. The market got messed up very quickly.
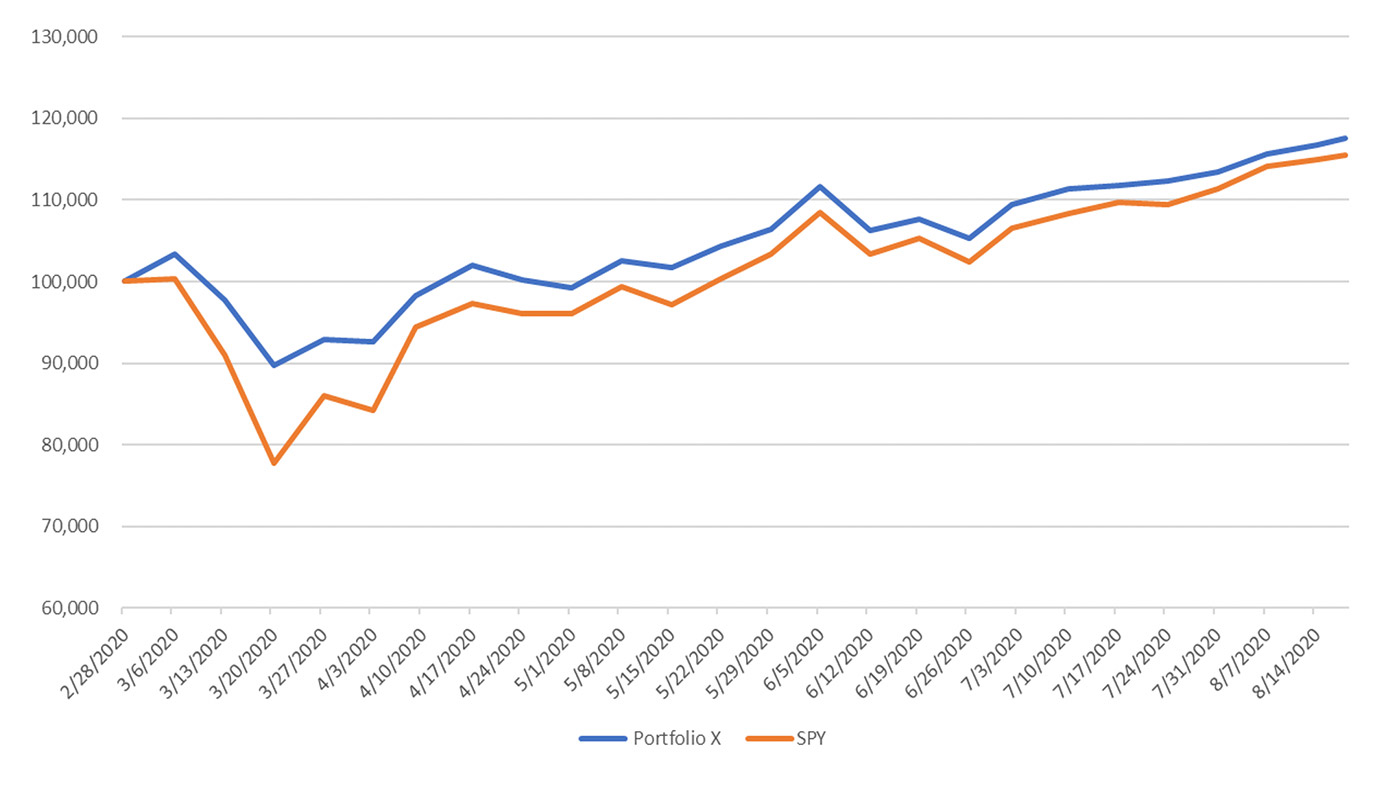
To recap, I named the strategy “Portfolio X.” It comprised six sector ETFs and one inverse S&P 500 ETF, and you had to stay fully invested.
The strategy compared the current end-of-week price of an ETF to the highest end-of-week price within 12 weeks. Those ETFs that had better or equal results to SPY (the SPDR S&P 500 ETF) are equally allocated at the end of each week.
It is relevant now to post the results.
From Feb. 28, 2020, to Aug. 18, 2020, Portfolio X gained 17.5%. The deepest drawdown was 10.3%. Over the same period, SPY was up 15.5%. Its deepest drawdown was 22.3%. The strategy worked again. Of course, we always have the option of exiting the strategy if our analysis points to an ugly scenario.

Sources: market data, Ian Naismith
Speaking of ugly, I thought it would be interesting to play Dr. Doom and assume we will experience another “oh my gosh” dip in the markets within the next year.
So, I picked five periods in the past 13 years of market stress and stitched them together.
These stitched-together periods, taken as a whole, knocked the snot out of the Vanguard Total Market ETF (VTI), which over those combined periods was down 80.3% (because I am not considering any “run-ups” after the drawdown periods).
I then looked at a universe of 2,100 ETFs and filtered it down to less than 400. (I removed ETFs that weren’t launched yet during the period studied, and I did not use leveraged or inverse ETFs.)
The top result from a performance perspective was not surprising: Long-term bonds (10-plus years): TLT, SPTL, TLH, etc. Then, intermediate bonds: IEF, SPTI, etc. Then, the U.S. dollar: UUP (flight-to-safety logic). Then, 3-7 year U.S. government bonds, gold, Japanese yen, mortgage-backed securities, short-term and ultra-short-term bonds, and TIPS (Treasury Inflation-Protected Securities). By the way, there were only 27 ETFs that posted positive total returns out of the nearly 400 that I analyzed.

Sources: market data, Ian Naismith
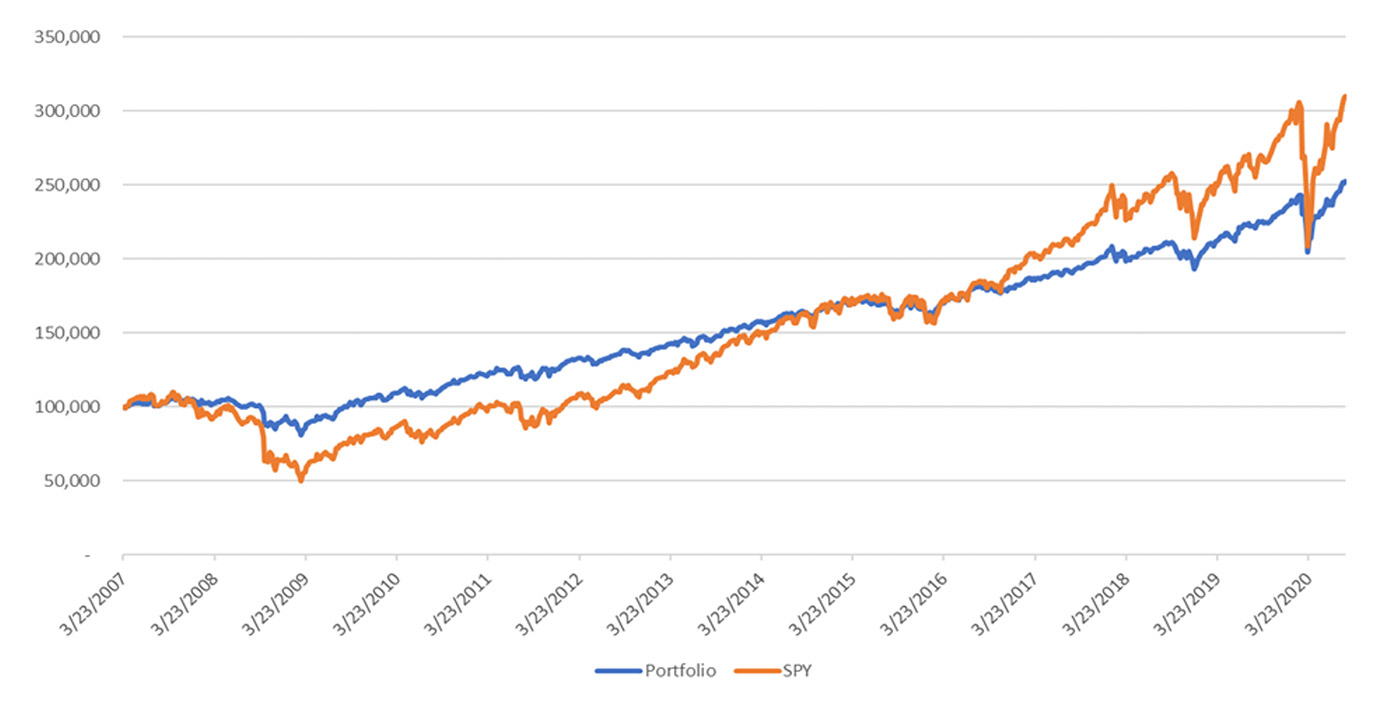
By way of developing a strategy, 50% was allocated among the 10 components and the other 50% was allocated to VTI, capturing the rebound periods for VTI along with the drawdown periods.
I rebalanced the portfolio annually and compared it to a simple SPY buy-and-hold strategy.
The results were good. SPY’s compound annual growth rate (CAGR) for that period is 8.79% versus 7.14% for the portfolio (which is only 50% equity). However, the deepest drawdown experienced by the portfolio was 23.7%, compared to 54.6% for SPY. The standard deviation was 55% less than SPY’s, so there are some significant benefits to this approach, despite the somewhat lower return.

Sources: market data, Ian Naismith
 Ian Naismith is a partner and the index designer of Smooth Sailing Indexes Inc., which is a leader in tactical “risk-on/risk-off” index development. Mr. Naismith has been analyzing and trading the markets since the early 1990s. He is a member of the National Association of Active Investment Managers (NAAIM) and has also served as board member and president. www.smoothsailingindexes.com
