

All three major market indexes ended last week with losses, but all of the declines were 0.5% or less. The market action was notable last Thursday, with the S&P 500 down 1.1% at one point, only to recover to a relatively small loss of 0.4%. Barron’s notes that the S&P 500’s streak of 47 trading days without a decline over 0.5% is the longest such streak since 1965, highlighting the extremely low volatility seen in today’s market. (Editor’s note: The streak came to an end on Nov. 15, with the S&P 500 declining 0.56%.)
The research firm Bespoke Investment Group, which has been quite bullish in its outlook over the past few years, continues to express some level of incredulity about the current run in the market. They are not arguing with the results, but rather the fact that any and all “bad news” seems to be quickly discounted by investors.
That said, they point to two market internals they think warrant attention.
The first is the extremely high level of the Relative Strength Index (RSI) across key global markets (U.S., Japan, Europe, China), which “suggests that we may be in for a period of consolidation and tactical weakness.”
FIGURE 1: S&P 500, NIKKEI, STOXX 600, AND CSI 300 AVERAGE 14-DAY RSI

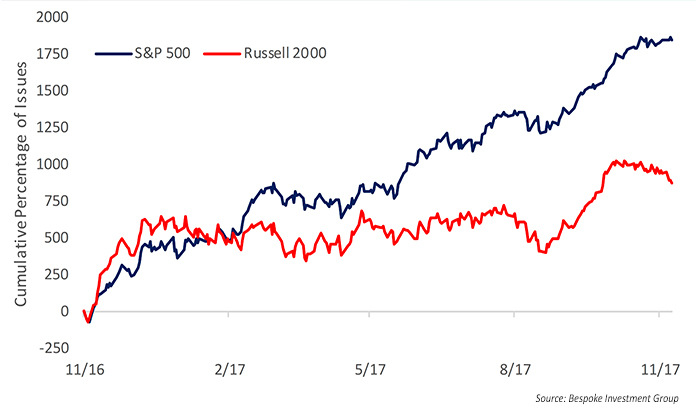
The second concerns the divergence between the advance/decline trends (cumulative breadth) of the S&P 500 versus the Russell 2000. They point out that this could have to do with expectations around tax reform, but, generally speaking, some analysts view the performance of smaller-cap stocks as an early indicator for the broader market.
FIGURE 2: CUMULATIVE BREADTH S&P 500 VS. RUSSELL 2000 (LAST 12 MONTHS)
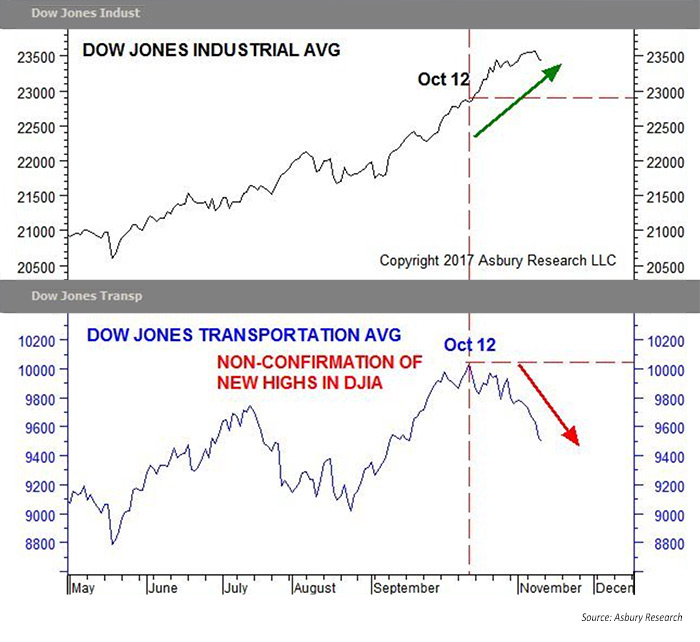
Asbury Research said this week that of the key factors it tracks in monitoring short-term trends, five are now bullish and four bearish, which “is shifting toward more of a bearish outcome.” One of these is based in Dow Theory. Figure 3 shows, according to their commentary, “The Dow Jones Transportation Average (DJTA) peaked and turned lower on October 12th while DJIA has continued to make new all-time highs. This non-confirmation of the new highs by DJTA is a bearish warning signal according to Dow Theory, and often precedes U.S. broad market peaks.”
FIGURE 3: DOW JONES INDUSTRIAL AVERAGE (DJIA) VS. TRANSPORT AVERAGE (DJTA)
Looking out several months, Asbury Research has a more bullish viewpoint:
“However, it would take a sustained decline below 2553 for the S&P 500 (SPX) this week, amid relative outperformance by junk bonds versus equities, to confirm that a countertrend market decline is underway. Seasonally, if such a market decline is to take place, it is more likely between now and the second week of December. Bigger picture, however, and minor corrections aside, we see the potential for an additional 9% to 16% rise, overall, into the 2nd quarter of 2018.”
Bespoke Investment Group cites other internal market indicators that raise concerns about how “late in the cycle” this bull market really is. But they conclude, as most observers do, that it has been a highly unusual market environment that has defied expectations and will probably continue to do so into the end of the year:
“Given the contrasting picture between the deteriorating internal indicators we track and the positive seasonal trends that equities typically see to close out years similar to 2017, how the rest of the year will play out will be interesting to say the least. We wish we had the answer as to which way things would unfold, but like everyone else, we simply don’t know.”