


As we have learned over the course of many bull and bear markets, prices alone can sometimes be misleading, especially those of large-capitalization-weighted price indexes.
When the vast majority of publicly traded companies are not mega- or even large-cap companies, it’s important to remember that the stock market is a “market of stocks.”
This is why measuring stock market breadth is so valuable. Breadth in these terms is a gauge of “market internals” (i.e., how many stocks are actively participating in an uptrend). In the same way that a doctor with the right tools and experience can diagnose an ailment in an otherwise outwardly healthy-looking patient, we strive to do the same as it relates to the health of market trends.
There are many ways to examine stock market breadth, but one of the oldest and most dependable measures is the advance-decline line (A-D line). The A-D line measures net advances defined as the number of advancing issues less the number of declining issues. Each trading day, net advances are added to the previous day’s index level.
A stock market is considered healthy when the uptrend and new highs in the major price indexes are matched by a similar uptrend and new highs in the A-D line. When this is true, it can be said that the soldiers (the multitude of smaller-cap issues) are following the generals (the largest-cap stocks) and are marching together. In the battle of supply and demand, logically a large force of rising stocks makes for a more durable, broad-based advance compared to a much smaller group of rising stocks.
The most widely known and used advance-decline line is the New York Stock Exchange (NYSE) All-Issues Advance-Decline Line, which compiles the daily net advancing issues for the NYSE Composite. Using this indicator to evaluate the internal health of the stock market is straightforward. The A-D line of a healthy market reflects broad demand from buyers. This apparent strength of demand is associated with a bull market and should result in matching highs and uptrends in both the A-D line and index prices.
By contrast, in an unhealthy market, near an important market top, the A-D line typically diverges from gains in the major large-cap-weighted price indexes for months before the final bull market highs. This means that while the major price indexes continue higher, the NYSE Advance-Decline Line is already in a downtrend (i.e., a majority of stocks have dropped out of the bull market). In fact, nearly every major market top in the last 100 years shares this distinction, with divergences stretching as long as two years. Among the most recent advance-decline line divergences occurred ahead of the financial crisis bear market, which began in June 2007—well before the final stock market peak in late October 2007.
But, the NYSE All-Issues Advance-Decline Line is not without flaws. As a result of the inclusion of nonoperating company issues such as preferred stocks, closed-end bond funds, and ADRs (American depositary receipts), the NYSE All-Issues Advance-Decline Line can be a very dull warning bell. The reason is that these nonoperating company issues (except ADRs) tend to behave more like bonds than stocks. This means that divergences can carry on for many months, often making them easy to ignore, especially if investor portfolios are still rising.
As an innovation to the old NYSE All-Issues Advance-Decline Line, Lowry’s Operating Companies Only (OCO) Segmented Advance-Decline Lines only include the operating companies/common stocks listed on the NYSE.
The concept is to isolate the stocks in the given index for a more accurate view of the traditional All-Issues Advance-Decline Line. Taken a step further, the “segmented” nomenclature refers to our breaking out the OCO index by market capitalization. This again helps us to understand more about market internals and what is driving this market of stocks. For example, we have learned through our 90-plus-year history of analysis that small-cap issues are typically the first to roll over as the new bear market approaches, then the mid-caps, and finally the large-caps (which dominate the major price indexes).
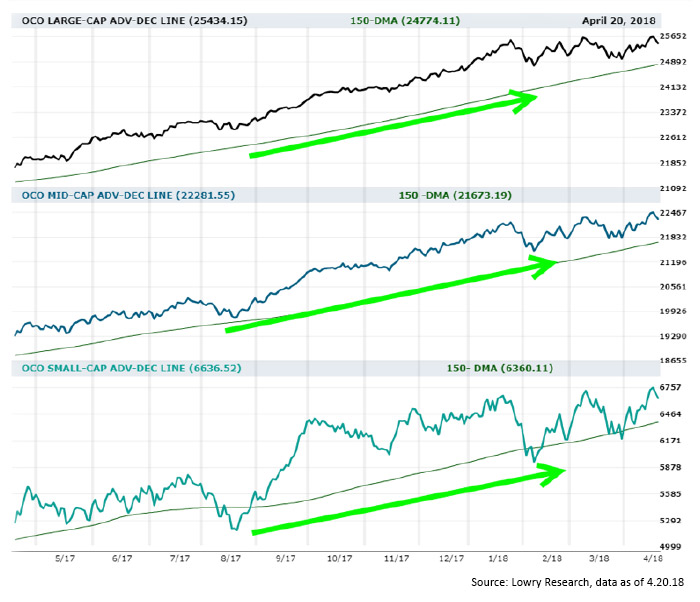
With this knowledge, investors are able to gradually adjust their portfolios accordingly by first scaling out of small-cap issues when the OCO Small-Cap A-D Line begins to diverge, then the mid-caps, and so on. The additional benefit is that investors are not surprised by bear markets. Instead, they understand that market tops are formed by an erosion of demand that manifests itself in fewer and fewer rising stocks. Lowry’s OCO Segmented A-D Lines (below) are currently near new all-time highs for all three market-cap segments. For now, this action lends credence to the health of the bull market, despite the rising volatility in the markets.
Figure 1: NYSE—OPERATING COMPANY ONLY (OCO) A-D LINES SEGMENTED BY MARKET CAP
The opinions expressed in this article are those of the author and do not necessarily represent the views of Proactive Advisor Magazine. These opinions are presented for educational purposes only.
 Vincent Randazzo, CMT, is a senior market analyst at Lowry Research with more than 15 years of experience in professional equity market research, technical analysis, and market intelligence. Before joining Lowry, Mr. Randazzo was chief market analyst at NASDAQ. He was also director of research at ICAP and a research salesperson at Morgan Stanley and UBS. He has been a Chartered Market Technician (CMT) since 2008. For more information on Lowry Research, please visit lowryresearch.com.