Leverage for the long run

‘False precision’ explored: There is never certainty in terms of market or strategy outcomes, only probabilities and managing risk—and whether you have the emotional fortitude to stick with a plan and process over time.
“There is no science in this world like physics. Nothing comes close to the precision with which physics enables you to understand the world around you. It’s the laws of physics that allow us to say exactly what time the sun is going to rise. What time the eclipse is going to begin. What time the eclipse is going to end.”
— Neil deGrasse Tyson, American astrophysicist, cosmologist, and author
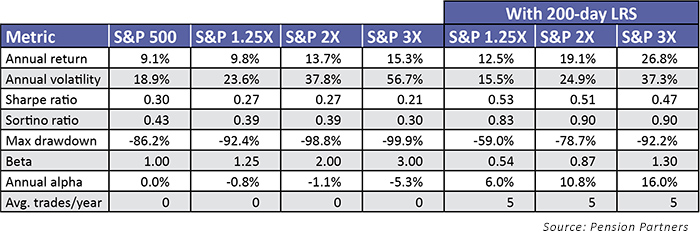
Our most recent research paper, “Leverage for the Long Run—A Systematic Approach to Managing Risk and Magnifying Returns in Stocks” delves into moving averages and leverage. We show that using moving averages can help manage risk over time and enable you to systematically employ leverage to enhance returns.

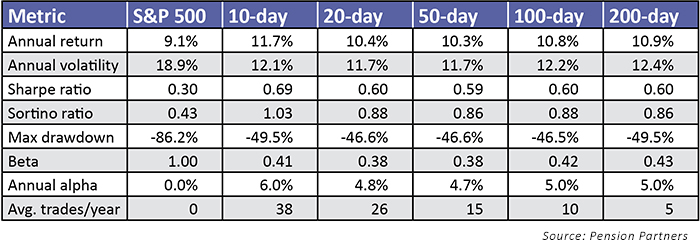
In the paper, we illustrate the performance of strategies using moving-average time periods that are popular among market participants: 10-day, 20-day, 50-day, 100-day, and 200-day.
The rotation works as follows. If the S&P 500 closes above its moving average, go 100% into the S&P 500 and use some leverage. If it closes below the average, go 100% into Treasury bills. Simple.
Going back to 1928, using any of these moving averages to time your exposure to equities, even without leverage, would have beaten a buy and hold of the S&P 500 with significantly lower volatility (ignoring transaction costs/slippage, etc.).


When we presented these and other findings to the Market Technicians Association at their Annual Symposium and on a recent webcast, there were a number interesting questions. Many were focused on how one could improve upon the results.
“Did you test the strategy using exponential moving averages? Did the returns improve?”
“Did you test the strategy using moving-average crossovers? Did the returns improve?”
“Did you test the strategy using the slope of the moving average? Did the returns improve?”
“Did you test the strategy using x-day moving average? Did the returns improve?”
The short answer: sometimes yes, sometimes no.
There are an infinite amount of permutations of time periods and indicators that you could use to achieve a better past return. But simply optimizing for the best past return with the lowest volatility was not the purpose of the paper. Our goal was to disprove popular notions about leverage and moving averages and to illustrate an anomaly that challenges some of the central tenets of the CAPM/EMH.
What would be the point of optimizing for the perfect past return unless there was some fundamental reason why a certain time period/indicator should continue its outperformance in the future? Lacking such a reason, you are merely chasing optimization by trying to find the precise time period/indicator combination that would have given you the best past result.
Far too often we take for granted how long-term performance using various indicators can look similar while in the short run that performance can look wildly different. This is true whether you are using technical indicators such as moving averages or momentum, fundamental indicators such as price to earnings/book/sales, or macro indicators. There is a cycle to everything.
Let’s run through an example to make this point clearer.
If you were launching the simple moving-average rotation strategy outlined above (unleveraged version) in March 2009, the 10-day moving average would be the easiest choice as it had the highest return.
Since March 2009, how has the 10-day strategy performed versus other time periods?
It has been the worst-performing time period, with an annualized return of 3.9%. The best time period has been the 100-day moving average (9.5% annualized) followed by the 200-day moving average (8.8% annualized).

Does this mean that the 10-day moving average is “broken” and you should switch to the 100-day or 200-day moving average going forward?
Perhaps, but it is equally possible that we were simply in a time period that has been unfavorable to short-term trend following and that has been more favorable to longer-term trends. In the next few years that could continue to be the case or it may change. We’ll only know the answer in hindsight.
The broader point here is that by chasing optimization and trying to find precision in a field where there is none (investing) you may end up doing more harm than good. Why? Because if you have found an indicator that actually has value (which is very rare to begin with), obsessively tinkering with it runs the risk of canceling out any benefit. If various permutations of that indicator go through cycles, you are merely chasing your tail in switching to the one that’s “working,” buying high and selling low, again and again.

We don’t pretend to know what the best moving average or time period is. No one knows because there is no such thing; it is constantly changing as the market environment changes and indicators go through cycles. If you like a 45-day/137-day exponential moving-average crossover system better than the simple averages discussed in the paper, great. Who are we to tell you that it won’t work?
More important than your choice of indicator, though, will be whether you’re willing to stick with that indicator when it inevitably goes through tough times and periods of underperformance. Can you avoid the temptation to abandon your system or re-optimize to what’s currently “working”? Most can’t or won’t, which is yet another reason why active managers fail; there is no consistency in terms of process and unwillingness to accept the bad with the good.
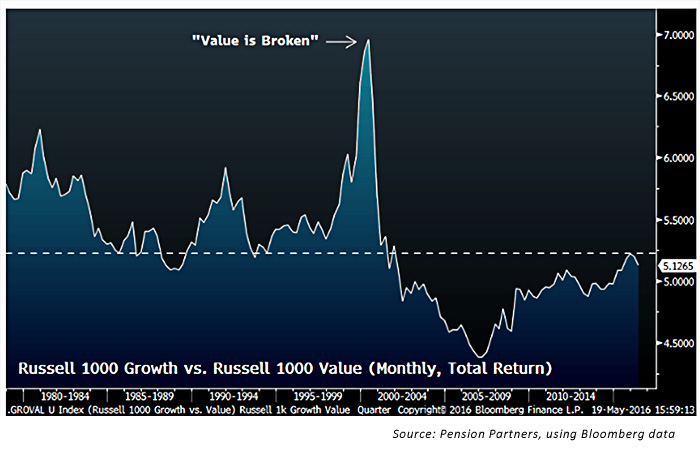
But what if the process/indicator really is “broken” and should be abandoned? Good question—and one that every value manager faced back in 1999/2000.

There is no easy answer to this question. It ultimately comes down to whether you believe (a) your indicator never had value in the first place, (b) something fundamentally changed in the world, or (c) the market environment is just not favoring your style or strategy in the short run.
Unfortunately, there is also no easy way to differentiate between a, b, and c, and if it is “c,” the short run may last longer than you think, testing the patience of you and your clients. Not a very satisfying conclusion, but it is the best one we can offer. We are not dealing with the laws of physics but instead with the unpredictable world of investing.
Disclosure: This writing is for informational purposes only and does not constitute an offer to sell, a solicitation to buy, or a recommendation regarding any securities transaction, or as an offer to provide advisory or other services by Pension Partners, LLC in any jurisdiction in which such offer, solicitation, purchase or sale would be unlawful under the securities laws of such jurisdiction. The information contained in this writing should not be construed as financial or investment advice on any subject matter. Pension Partners, LLC expressly disclaims all liability in respect to actions taken based on any or all of the information on this writing.
Pension Partners LLC, an independent registered investment advisor, was founded in 1999. Pension Partners LLC offers its buy-and-rotate approach worldwide through mutual funds, separate accounts, and model portfolios. They offer a unique proprietary investment process that rotates offensively or defensively based on historically proven leading indicators of volatility. https://pensionpartners.com
 Michael A. Gayed, CFA, is chief investment strategist and co-portfolio manager at Pension Partners LLC, an investment advisor that manages mutual funds and separate accounts. Mr. Gayed has also served as a portfolio manager for a large international investment group. He is the co-author of four award-winning research papers that challenge market efficiency. https://pensionpartners.com
 Charlie Bilello is the director of research at Pension Partners LLC, an investment advisor that manages mutual funds and separate accounts. He is the co-author of four award-winning research papers on market anomalies and investing. Mr. Bilello is a Chartered Market Technician (CMT), a member of the Market Technicians Association, and holds the Certified Public Accountant (CPA) certificate. https://pensionpartners.com
