According to Bloomberg radio on Monday, Sept. 19, the average analyst estimate for the S&P 500’s closing level by year-end 2022 stands at 4,346.
Based on the S&P 500 close at 3,873 on Friday, Sept. 16, that represents a very healthy rally of 12% by the end of the year.
Prospects for the markets looked particularly poor after last week’s market action, driven in large part by August’s consumer-price-index data and a downbeat outlook from FedEx. According to Barron’s this past weekend, “The Dow Jones Industrial Average fell 4.1% for the week, while the S&P 500 index dropped 4.8% and the Nasdaq Composite plunged 5.5%.”
Barron’s added,
“‘Investors are facing the reality that the Fed has more work to do and recession risk is high,’ says Dave Donabedian, chief investment officer at CIBC Private Wealth US. ‘We’re not talking about putting more money to work in equity markets. We’re preaching patience.’”
However, on a more positive note, Barron’s also then cited the following statistics:
“That would seem to go against the maxim that it often pays to be optimistic when everyone is predicting the worst. Sundial Capital Research’s Jason Goepfert notes that less than 1% of the stocks in the S&P 500 finished higher on Tuesday, something that has happened only 28 other times since 1940. The index gained an average of 15.6% over the following 12 months, and was higher 79% of the time.”
Mark Hulbert of MarketWatch is another prominent market observer trying to find a statistical silver lining in the market’s 2022 performance so far.
He notes that a representative 60/40 equity/bond portfolio was down 20.4% through Sept. 15, 2022. A loss of that magnitude, according to Hulbert, would be on track to be the fifth worst in market history for such a portfolio.
But he also notes that in the subsequent five-year period after losses of 20% or more in one year, a balanced portfolio’s returns were very strong.
TABLE 1: 60/40 PORTFOLIO RETURNS AFTER 20% OR MORE DOWN YEAR

Source: MarketWatch
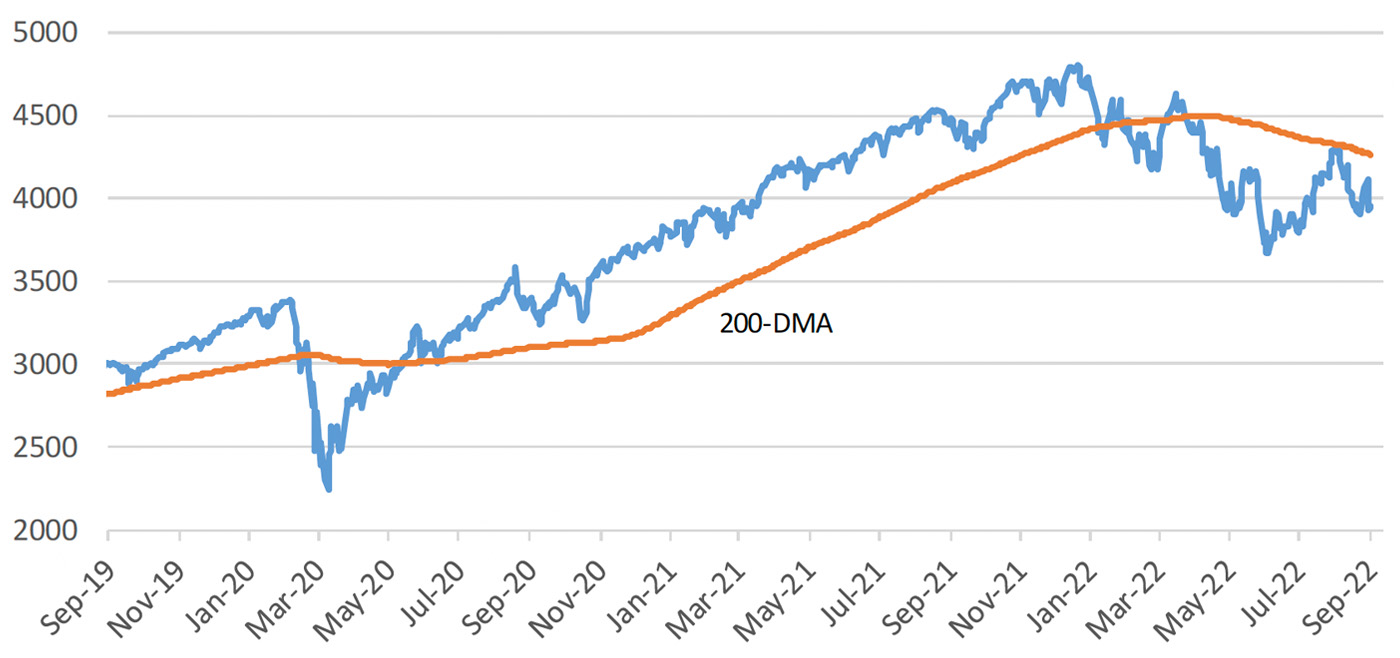
Looking at the current chart for the S&P 500 through Sept. 16, Bespoke Investment Group observed,
“After rallying more than 17% from its mid-June low to its mid-August high, the S&P has now fallen 11% since then. In true bear market fashion, the index began the month of September with a 4% gain through 9/12, but it has fallen more than 6% over the last four trading days and taken out its September 2nd low in the process. The S&P is still 4.9% above its mid-June low, but the likelihood of those June lows being tested is increasing with every tick down (and we’ve sure been getting plenty of downticks lately). …
“The S&P 500’s inability to break above its 200-day moving average in mid-August kept the downtrend in place. Now the index is heading back towards its bear market low in June, and if that level breaks, technicians will be calling for S&P 3,300-3,500 before downside support comes into play.”
FIGURE 1: S&P 500 WITH 200-DAY MOVING AVERAGE

Source: Bespoke Investment Group
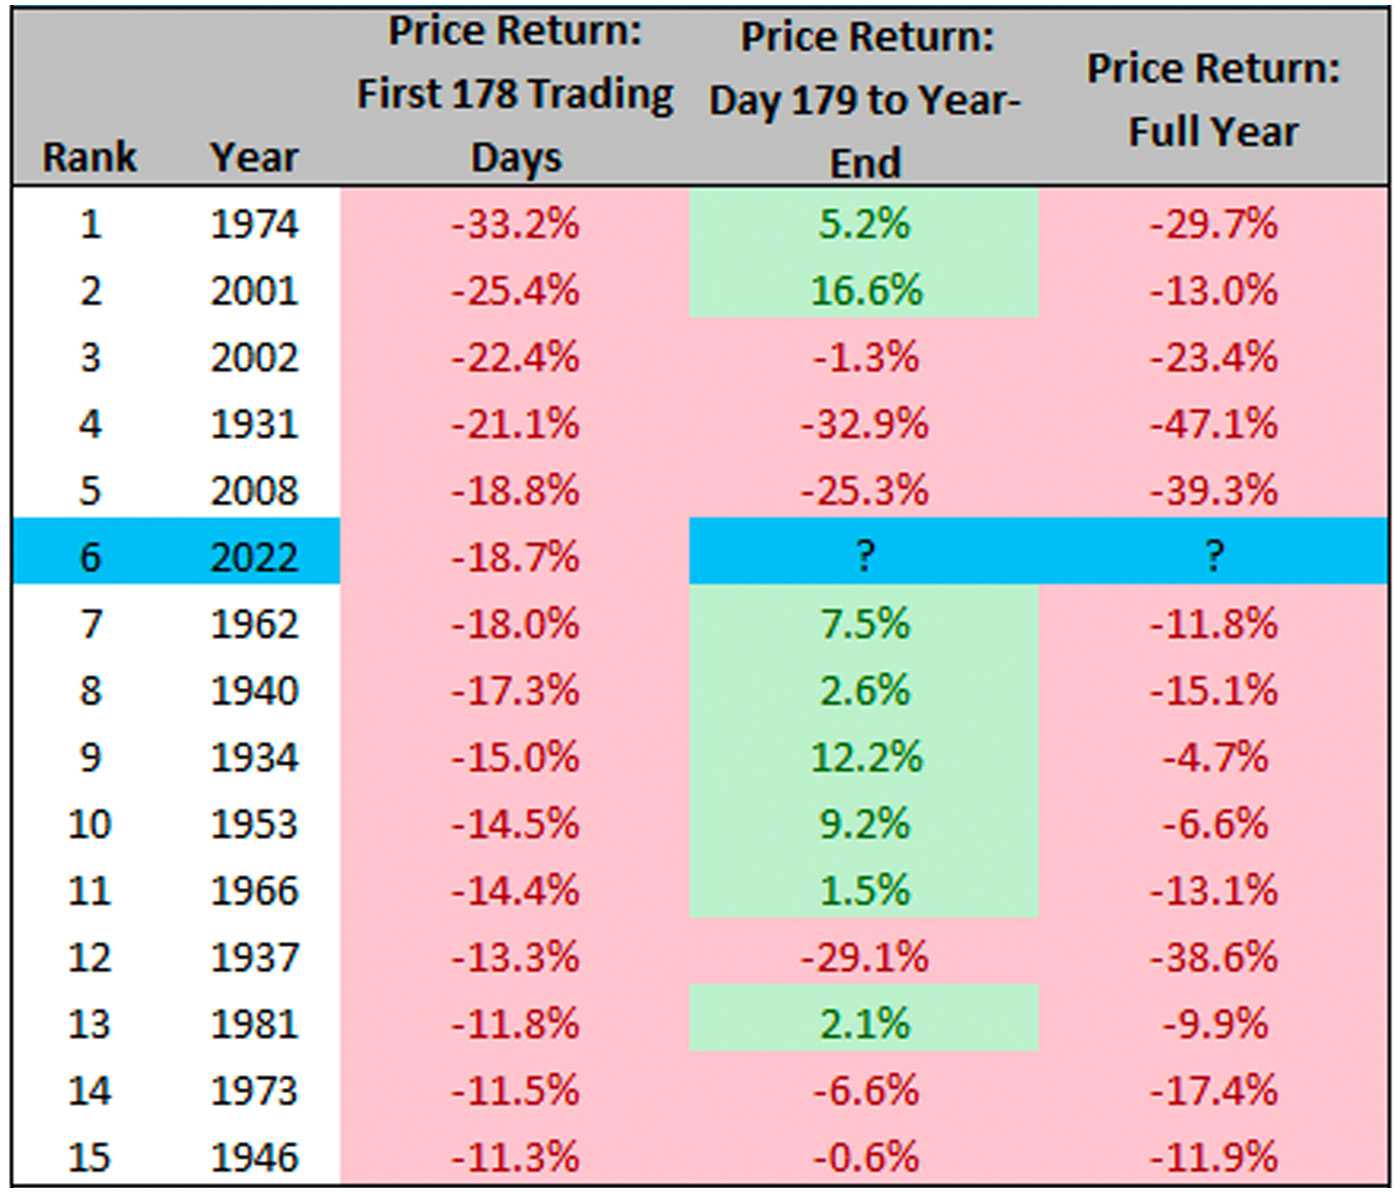
Charlie Bilello, founder and CEO of Compound Capital Advisors, shared the following historical-data table last week on Twitter. While offering some hope for an S&P 500 rally into year-end, it also points out the likelihood of overall negative returns for the year.
TABLE 2: S&P 500—WORST ANNUAL PERFORMANCE THROUGH 178 TRADING DAYS (1928–2022)

Source: Charlie Bilello, Compound Capital Advisors
New this week:
