As of the end of last week, 98% of S&P 500 companies have reported Q3 2105 earnings, allowing for a fairly comprehensive look at how the season actually fared. A rising chorus of market commentators continues to criticize the relevance of “beat rates” on EPS and revenues, citing the incessant revisions and “lowering of the bar” going into the actual reports of each company.
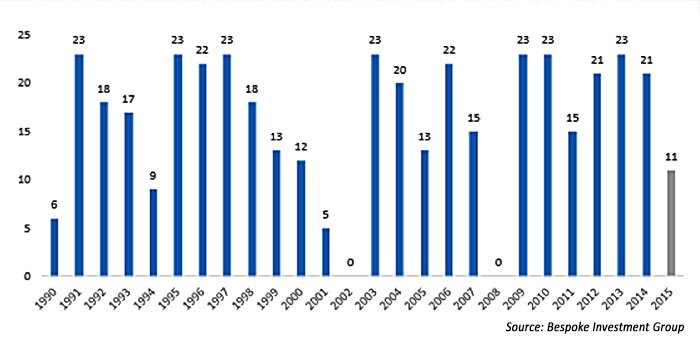
NUMBER OF INDUSTRY GROUPS WITH POSITIVE ANNUAL RETURNS BY YEAR: 1990-2015

That being said, it was a decidedly mixed season for earnings. There were some very bright spots but also major negative headlines. Here are some of the key highlights according to FactSet:
- 74% of the companies in the S&P 500 have reported earnings above the mean estimate, but only 45% of companies have reported sales above estimate. In aggregate, companies reported earnings that exceeded expectations by 5.7%. This “surprise” percentage is above the 5-year (+4.8%) average.
- The blended earnings decline stands at -1.3%, presenting the first back-to-back quarters of earnings declines since 2009. The blended revenue decline is -3.9%. This marks the largest year-over-year decline in revenue since Q3 2009 (-11.5%), according to FactSet’s analysis.
- For the upcoming Q4, 81 companies have issued negative EPS guidance, and 26 companies have issued positive EPS guidance.
Not surprisingly, the Energy and Materials sectors continued to be the biggest drag on overall S&P 500 results, down 56.8% and 15.8%, respectively, on earnings. On the flip side, Telecom (+23.5%), Health Care (+14.7%), and Consumer Discretionary (+13.3%) led the sector results for Q3.
The performance of retailers this holiday season continues to be a source of heavy market speculation. Reports on Black Friday weekend are lackluster for brick-and-mortar retailers, yet online sales appear very strong. Projections have seven of the 13 retail subindustries in the S&P 500 set to report declines in Q4 earnings, while Internet retailers are forecast to show a whopping 52% earnings increase.
The Q3 earnings season continues 2015’s theme of “haves and have nots,” with conflicting currents from the energy industry, commodities, currencies, economic segments, and consumer spending affecting different sectors in very different ways.
Says Bespoke Investment Group, “Big gains in some of the market’s largest stocks are masking weakness among some of the S&P 500’s smaller components and weak breadth within the S&P 500’s Industry Groups. Just 11 of the 24 Industry Groups are up on the year so far, the weakest annual reading since 2008 when all 24 groups were down.”
