Editor’s note: Following publication of this article, the markets sold off hard on Thursday, Sept. 3, with major U.S. indexes down from 2.8% to 5%. The commentary by some of the analysts quoted here on “overbought” conditions in the market was right on the money—at least in the short term.
The market adage “Sell in May” certainly has not been working in 2020, much to the delight of bullish and long-only investors.
According to MarketWatch, the market closed on Monday (Aug. 31) with “the strongest August return in decades.”
August’s increase of 7% for the S&P 500 comes on top of a gain of 1.8% in June and 5.5% in July.
Fox Business wrote earlier this week,
“All three of the major averages look to be on track for a fifth straight month of gains and are looking at their best five-month stretches in years. With one trading day left in August, the Dow has rallied 31% since the end of March and is on pace for its best five-month stretch since March 1986. The S&P 500, meanwhile, has climbed 36%, the largest five-month advance since October 1938, while the Nasdaq has surged 52%, unrivaled since the peak of the tech bubble in March 2000.”
Reuters noted,
“The S&P 500 hovered near record highs on Monday as bets on an economic revival due to prolonged central bank support put the index on course for its best August in decades. The Federal Reserve’s commitment to tolerate inflation and keep interest rates low, positive developments in vaccines and treatments for COVID-19, and a momentum-driven rally in tech-focused stocks have helped the S&P 500 and Nasdaq hit consecutive all-time highs.”
For the year, the Dow finished August barely in the red, the S&P 500 gained 8.3%, and the NASDAQ Composite Index was up over 31%. Of course, some have noted that the rally has been concentrated in a few top tech names with outsized gains, with many of the S&P 500’s component stocks (and sectors) still negative for the year.
Bespoke Investment Group published two charts showing the highs and lows of the market for the past month and year.
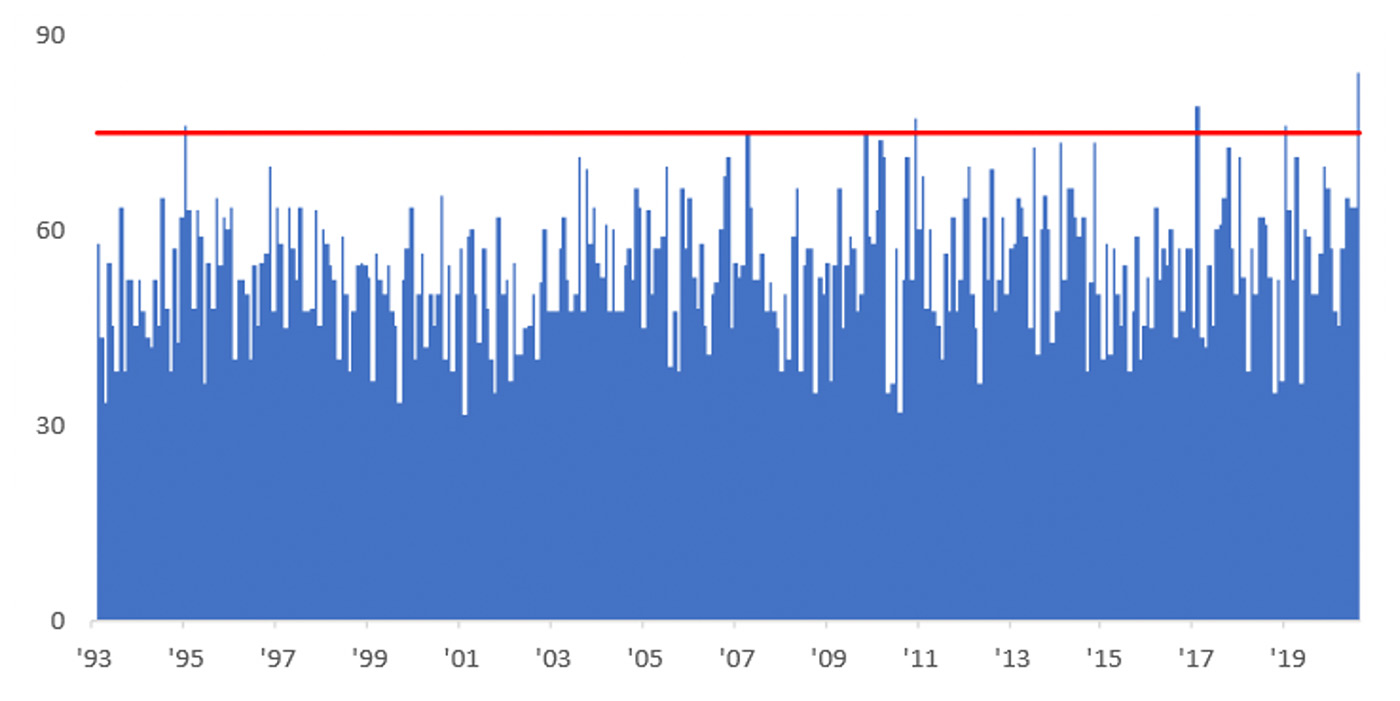
The first shows how “the relentless nature of the S&P 500’s rally in August has been historic.” Bespoke notes,
- “Since the [SPY] ETF started trading in 1993, there has never been another month that had a higher winning percentage, and it’s right up there with the 2016 Warriors or the 1996 Bulls.
- As shown in the chart [Figure 1], there have only been six other months in SPY’s history where the ETF had a winning percentage of even 75% or more.”

Source: Bespoke Investment Group, data as of 8/28/2020
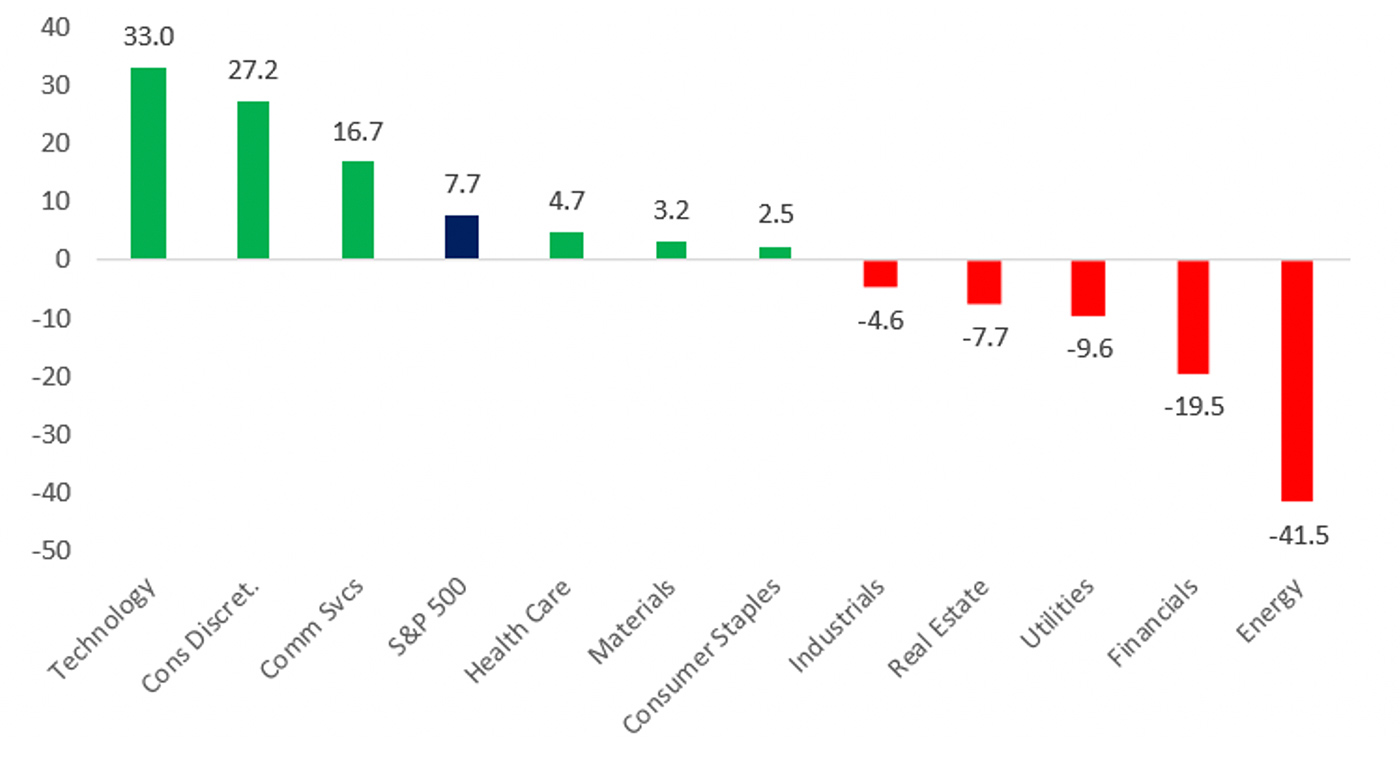
Figure 2 shows relative sector performance through Aug. 26. Bespoke says,
“2020 has clearly been a case of the haves and have nots. On the haves side, Technology (XLK) and Consumer Discretionary (XLY), which is basically Amazon (AMZN) and a few other retailers, top the list. Rounding out the top three, Communication Services (XLC) is the only other sector up over 10% and outperforming the S&P 500. On the have-nots (or in this case, the ‘nearly halves’) side, we have Energy leading the way lower with a decline of over 40%, followed by Financials (XLF) which is down roughly 20%.”

Source: Bespoke Investment Group
The market’s current level and valuation, especially in light of still-elevated unemployment, an uncertain GDP outlook, and the sector divergences shown in Figure 2, is under much scrutiny.
National Securities’ Art Hogan has warned that a key technical trend suggests the S&P 500′s record win streak is running into trouble. “We’re overbought in the S&P 500 as an index in the short run,” the firm’s chief market strategist told CNBC’s “Trading Nation” on Friday. “It moved higher really quickly.”
Hogan, says CNBC, uses a chart of the relative strength index, otherwise known as the RSI, to build his cautious case. “When that sits around 50, you’re basically neutral. When it gets to 30, you’re oversold,” he said. “And, when you get to 60 or 70, you’re overbought. We’re currently at about 75 on the S&P 500. So, we’re clearly overbought.”
Hogan says that the technical outlook, combined with any number of potentially negative headlines, could see the S&P 500 drop 5% to 10% in the September and October time frame. “Nothing draconian, but certainly an opportunity to say there’s a better buying opportunity in front of us if we still have cash on the sidelines,” he said.
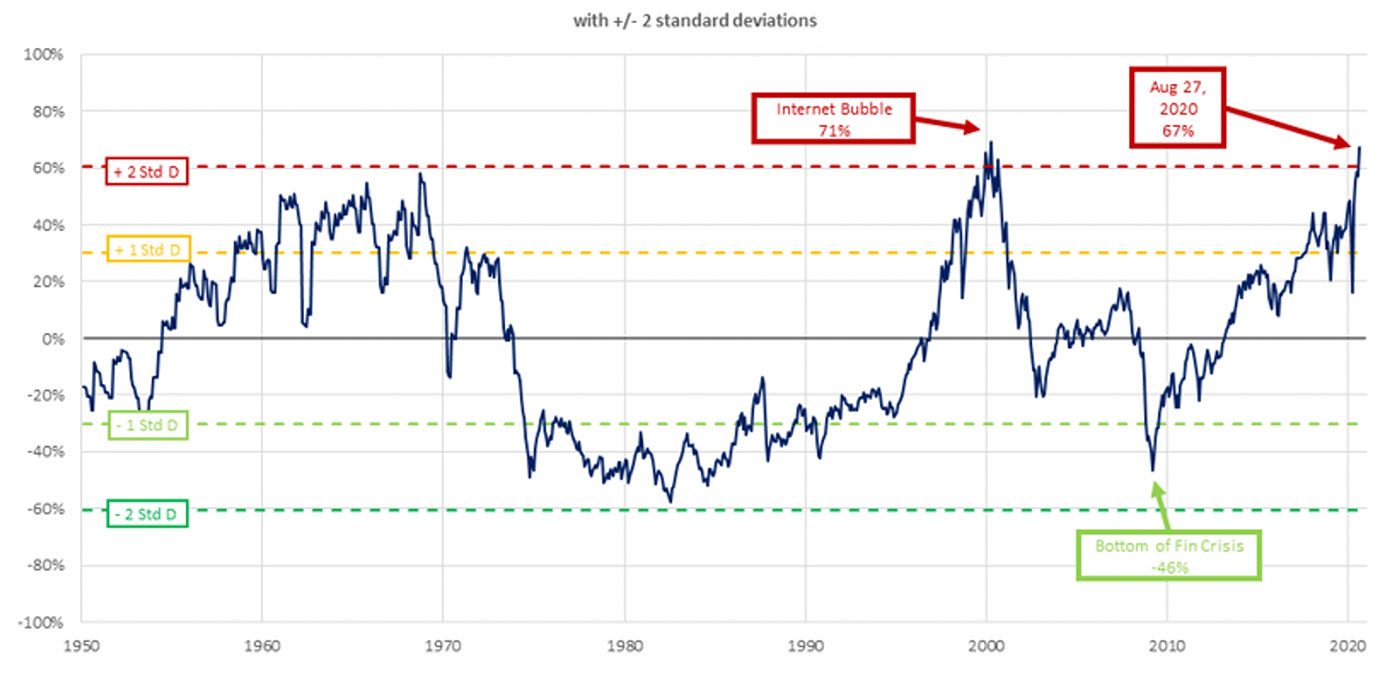
CurrentMarketValuation.com tracks four valuation indicators continually. As of Aug. 28, two of these were rated as “Overvalued” (S&P 500 P/E Ratio Model and S&P 500 Mean Regression Model) and two were “Strongly Overvalued” (Yield Curve Model and Buffett Indicator Model: a ratio of total U.S. stock market valuation to GDP).
The site noted recently for one of these models, “The Buffett Indicator (named after Warren Buffett, who claims this as a favorite macroeconomic indicator) is the ratio of total US stock market valuation to GDP. This is currently 67% higher than its historical average, indicating the market is currently Strongly Overvalued.”

Source: currentmarketvaluation.com
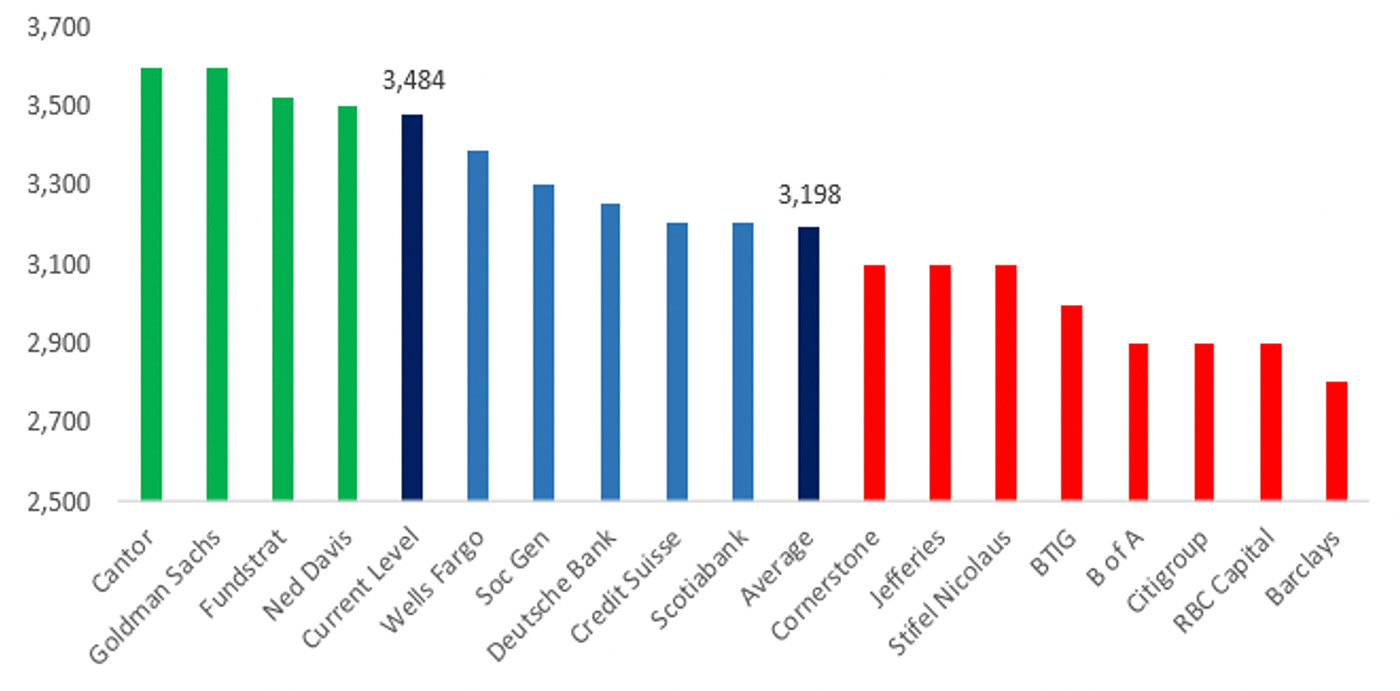
Interestingly, the market’s 2020 surge since the bottom in March appears to have caught many major Wall Street analysts by surprise. Bespoke Investment Group charted the current analyst calls for the S&P 500’s year-end finishing value, showing 13 of 17 analysts still with projections under the market’s current level.

Source: Bespoke Investment Group
Canaccord Genuity’s Tony Dwyer, a frequent contributor to Proactive Advisor Magazine, addressed the issue of valuations in a recent client note. His comments, part of a more comprehensive analysis, reflect the highly unusual nature of the current market environment:
“A zero-interest rate policy and unlimited QE have no precedent, rendering valuation targets useless. We have carried a 3300+ 12-month S&P 500 (SPX) target since June and have emphasized the ‘+’ because we have no idea what multiple assumption to use. The combination of this reality and the outsized influence of the mega-cap stocks in the SPX causes us to withdraw our target because it would be a wild guess and could mislead investors of our view.”
