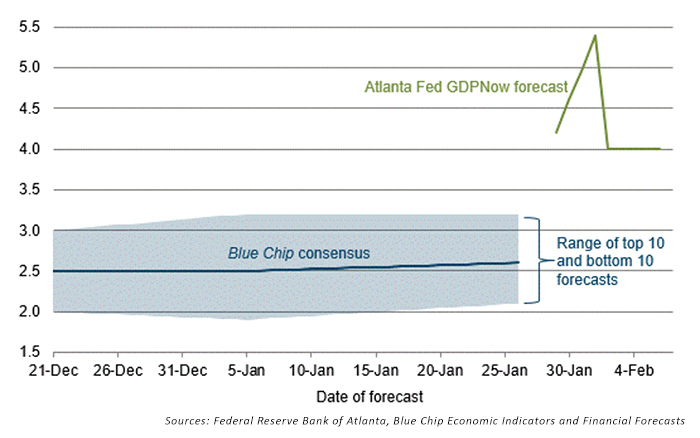
On February 1, the Atlanta Fed’s GDPNow model forecast 5.4% gross domestic product growth in the first quarter of 2018. Its latest estimate on February 6 downgraded the forecast to 4.0%.
Business Insider had written about the surprisingly aggressive earlier forecast,
“That’s much higher than what even the most bullish economists expect, but is based on only one month’s worth of data for the quarter. Many economists expect the economy to grow closer to 2.5% through 2019. … The last time the economy grew that much was in the third quarter of 2003. If correct, this would be the first period of more than 5% growth since the third quarter of 2014. Additionally, the forecast is much higher than that of the most bullish economist polled in the Blue Chip forecast.”
FIGURE 1: EVOLUTION OF ATLANTA FED Q1 GDP FORECAST

What is driving this drop in the Atlanta Fed’s GDP forecast?
According to its release on Feb. 6, 2018,
“The GDPNow model forecast for real GDP growth (seasonally adjusted annual rate) in the first quarter of 2018 is 4.0 percent on February 6, down from 5.4 percent on February 1. On February 2, the forecast of first-quarter real consumer spending growth fell from 4.0 percent to 3.0 percent and the forecast of first-quarter real private fixed investment growth fell from 9.2 percent to 4.9 percent. On that day, the model’s estimate of the dynamic factor for January—normalized to have mean 0 and standard deviation 1 and used to forecast the yet-to-be-released monthly GDP source data—declined from 1.37 to 0.43 after the employment report from the U.S. Bureau of Labor Statistics.”
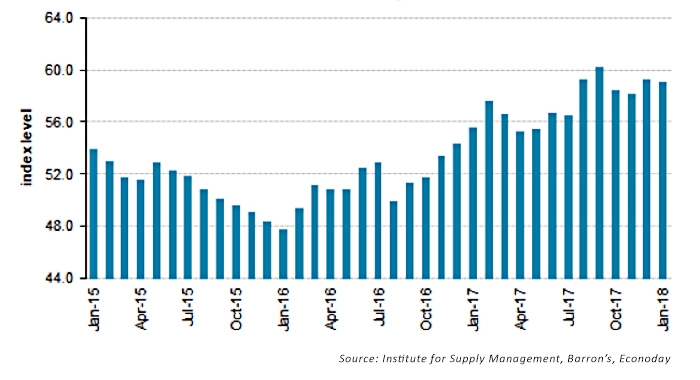
Previously, the Atlanta Fed had been encouraged by recent data from the Institute of Supply Management (ISM) in forecasting real private fixed investment and consumer spending, along with construction spending released by the U.S. Census Bureau. While the ISM’s overall manufacturing index came in at 59.1 for January—slightly below December—it beat consensus forecasts and, Barron’s notes, “New orders just keep pouring in, with the reading of 65.4 in January the best in nearly 10 years.”
FIGURE 2: 3-YEAR TREND FOR ISM MANUFACTURING INDEX

Despite the market sell-off, many analysts believe that strong corporate earnings and continued positive trends in employment data and consumer spending will provide intermediate-term support for the equity market.
But was the Atlanta Fed’s earlier 5%-plus forecast realistic? And how has it done on “out-of-the-box” forecasts in the past?
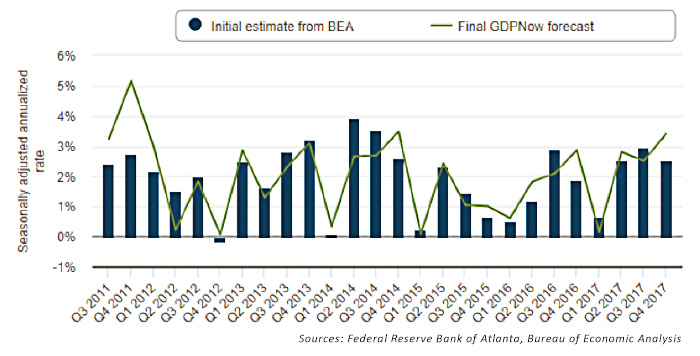
As can be seen in Figure 3, the Atlanta Fed has, on average, done a decent job of forecasting Bureau of Economic Analysis (BEA) initial quarterly GDP estimates. However, the most recent example of the Atlanta Fed predicting 5%+ GDP growth (Q4 2011) was followed by an actual BEA first estimate of 2.75%—quite a miss for the forecast.
FIGURE 3: ATLANTA FED GDPNOW FINAL GDP FORECASTS VS. BEA INITIAL REPORT

