The headlines this past weekend were full of doom and gloom for U.S. and global equity markets:
- “U.S. stocks extend their multi-month lows.”
- “Is global recession right around the corner?”
- “The worst first week of a new year, ever!”
- “International markets down 16% from May highs.”
- “Small-caps perilously close to bear market territory.”
- “Soros sees echoes of 2008 in today’s markets.”
There were plenty of additional variations of this theme, with a long litany of factors currently bringing down the markets. China’s currency/market/economy struggles, the Fed’s rate-hiking path, the commodity and energy swoon, geopolitical events, and a weaker outlook for corporate earnings topped the most recent list.
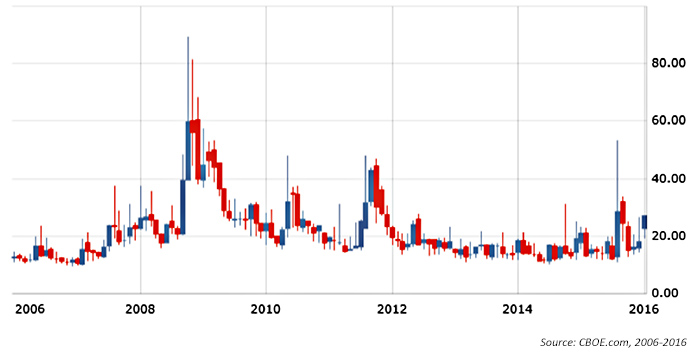
EXHIBIT 1: 10-YEAR VIEW OF CBOE VOLATILITY INDEX (VIX)

Many market-watchers were crunching the numbers on what history says about annual returns when markets start out the first five days in negative territory. At least those studies provided some ray of relative hope.
According to the Stock Trader’s Almanac, a positive “first five days of the year” has foretold positive annual returns 85% of the time, with an average yearly gain of about 14%. When markets are in the red for those five days, markets have about equal chance of being up or down for the year. However, returns for all those poor-start years are usually minimal, averaging 0.7%. (Says Bespoke Investment Group, “The range of returns for the remainder of those years has varied wildly, ranging from a decline of more than 37% to a gain of just under 46%.)
The picture can truly get murky and complicated, with a few of the many analyses looking at poor market starts to presidential election years, years in which the Fed has just started a new rate-hiking cycle, and years in which corporate earnings growth is slowing.
Perhaps TheStreet.com best nailed what could be the safest prediction for 2016: “Panic-driven stock selling is here to stay. Financial turbulence as well.”
But is a return to higher levels of volatility all that unusual?
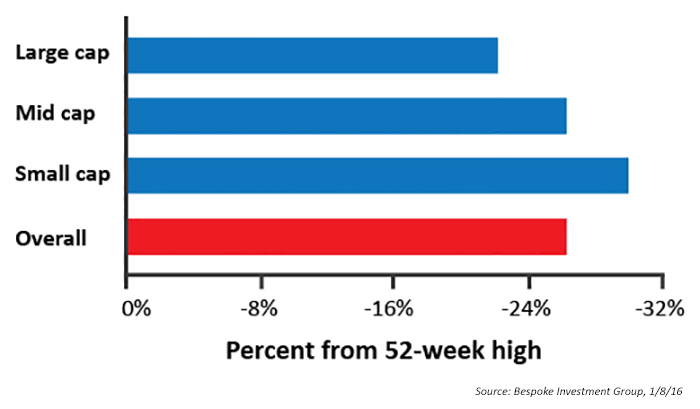
EXHIBIT 2: S&P 1500: AVG. STOCK DISTANCE FROM 52-WEEK HIGH

Barron’s recently had a very interesting take on the issue of “normal” levels of volatility in the markets, paraphrased below:
Volatility has surged to the highest level since last September, with the CBOE’s volatility index (VIX) closing Friday at 27, 60% higher than a year ago. However, the market is really not all that volatile (yet) from a historical perspective. From 1990 through 2014, the VIX spent about a third of the time between 20 and 30. In 2013 and 2014, the VIX was in that 20-30 range less than 1% and 5% of the time, respectively. As a result, when big moves come these days, it feels like the world is ending.
That said, it is hard not to sit up and take notice when, as Bespoke reported over the weekend, “Stocks in the S&P 1500 (which includes large-, mid-, and small-cap stocks) were trading on average 26.3% lower on Friday than their respective 52-week highs – that’s bear market territory!”
