The various groups control different facets of the trend creating the six primary market conditions. The uptrend or bull market is controlled by fundamentalists, while a bear market or a downtrend market correction is controlled by technical traders.
This distinction is often overlooked and is why price moves differently during an uptrend, and why an uptrend sustains longer than a downtrend. During a bear market or a market correction, only three market participant groups sell short.
Nine market participant groups
1. Buy-side and sell-side “giant” institutions that control enormous funds and the majority of shares of stock held in charters or trusts worldwide.
2. Wealthy private individuals and family estates who are primarily long-term investors.
3. High-frequency trading firms, known as HFTs.
4. Professional traders, including floor traders, proprietary desk traders, and independent traders.
5. Corporations, acting through buybacks, acquisitions, and various investments.
6. Smaller funds, which include foreign funds, sovereign funds, nonprofits, and thousands of local or regional franchised financial firms selling mutual funds.
7. Retail traders who rely primarily on technical analysis for short-term trading.
8. Small-lot self-directed investors who manage their own portfolios.
9. Odd-lot investors who trade small numbers of shares for a variety of reasons.
While fundamentalists study the financial health of a company, technical analysts study the reactions to financial data as well as other fundamental data. It is important to remember that technical analysis is not a predictive tool, but merely a visual reference to study how various market participant groups react to earnings reports, news, and other corporate events such as stock buybacks or new product introductions.
In all cases, the large institutions, also known as “dark pools” because of their preferred transaction venue, dominate at both the topping of a market prior to a major downtrend and at the bottoming of a market prior to the beginning of a bull market.
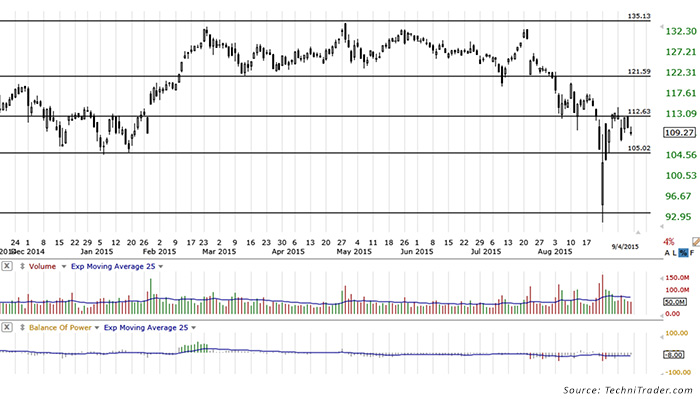
As an example regarding market participant groups and technical analysis, see the chart of Apple Inc. (NASDAQ: AAPL), which shows a topping action that started in March 2015.
This reflects the rotation by giant institutions lowering their inventory of AAPL stock shares from March through June. Once their Dark Pool Quiet Rotation was concluded, high-frequency traders began triggering on the news of that rotation. Smaller funds reacted late by selling as the stock moved down, which fueled professional traders who began to sell short; then there was more high-frequency action as the market reacted to international news.
The primary catalyst in the topping formation of AAPL was not the meltdown in China. It was the several-month period where giant institutions, controlling massive funds, slowly and consistently rotated out of AAPL to reduce their holdings, thereby lowering their exposure and risk as AAPL possibly heads into a business contraction cycle.
DAILY CHART FOR AAPL (APPLE INC.)

All statements are the opinions of TechniTrader, its instructors and/or employees, and are not to be construed as anything more than opinion. Examples presented are for educational purposes only. The opinions expressed in this article do not necessarily represent the views of Proactive Advisor Magazine.
 Martha Stokes, CMT, is the co-founder and CEO of TechniTrader and a former buy-side technical analyst. Since 1998, she has developed over 40 TechniTrader stock and option courses. She specializes in relational analysis for stocks and options, as well as market condition analysis. An industry speaker and writer, Ms. Stokes is a member of the CMT Association and earned the Chartered Market Technician designation with her thesis, "Cycle Evolution Theory." technitrader.com
