Is the S&P 500 really the ultimate buy-and-hold investment?

Understanding what the S&P 500 is and is not can help clients understand why it can be ill-suited as a long-term buy-and-hold investment position.
There is a tendency in the news media to accord the Standard & Poor’s 500 index with a precision and omnipotence that transcends reality. The S&P 500 has become the “everyman’s portfolio,” the measuring stick against which all else is determined a success or failure. It has become the gauge of the state of the U.S. stock market (although the Dow Jones Industrial Average (DJIA) still receives lead mention in many news reports).
For every move, a definitive reason (inevitably oversimplified and often wrong) is provided in the news and, all too often, the index is reported as if it is a reflection of the overall economy.
While there is no denying that the S&P 500 index has many excellent attributes and uses, it seems the world has lost sight of what it is and what it is not. The reality of the S&P 500 is that it provides a “carnival mirror” view of the stock market. The details may be accurate, but their application to the broader market, and even the individual stocks that make up the S&P 500, are distorted by the nature of the index. The index is also a lot risker as an investment model than its advocates care to admit.
What is the index distortion?
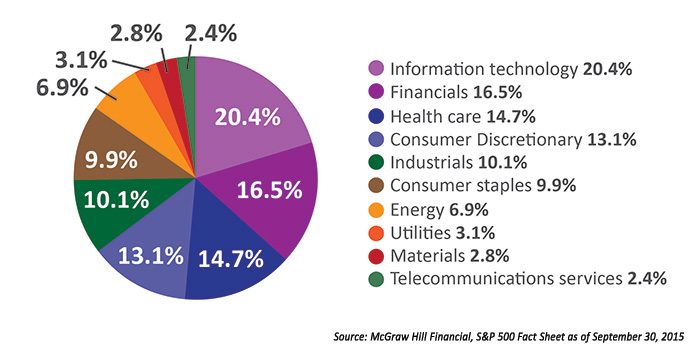
The stocks that make up the S&P 500 are capitalization weighted. The 20 largest stocks of the S&P 500 make up approximately 30% of the dollar value of the U.S. stock market. Apple Inc. (AAPL) alone is nearly 4% of that valuation. By capitalization weighting the stocks in the S&P 500, the index seeks to model the distribution of capital in the overall market.
While Apple is currently the largest U.S. stock based on market capitalization, studies show that Apple’s actual contribution to the U.S. GDP is more in the range of 0.3-0.5%1. Its 66,000 employees are less than 0.04% of the U.S. civilian workforce, although the company claims to have directly contributed to over one million jobs through apps development and jobs directly related to Apple’s growth and spending. Apple is an impressive earnings machine and technology innovator, but its disproportionate weighting in the S&P 500 (along with several other stocks) fundamentally distorts the value of the index as a barometer of the “big picture.”
2015 SECTOR BREAKDOWN

The capitalization-weighted nature of the index can mask the performance of the overall stock market and the economy. In 2014, the S&P 500 set record highs on 49 occasions, achieving an annual return in excess of 12%. The average performance of the stocks within the index, however, was a loss of 7.2%2. Throughout the first three quarters of 2015, declining stocks dramatically outnumbered advancing stocks among the S&P 500. These are still largely profitable, industry-leading companies—they have to be to be included in the index—but for one reason or another, their valuations were down.
In an attempt to exploit top performers in the S&P 500 and avoid out-of-favor stocks, an entire cottage industry of so-called smart-beta funds have been created that essentially use S&P 500 component stocks, but apply a variety of different weighting techniques in an attempt to outperform the index.
An actively managed index
The S&P 500 index in its present form began on March 4, 1957, and included 425 industrial stocks, 60 utilities, and 15 railroads, all listed on the New York Stock Exchange (NYSE) and covering roughly 90% of the total market value of the entire market. Only 69 of the 500 original companies remain in the S&P 500 (actually the S&P “505” as of September 2015!) and the sector distribution is considerably different. In the nine months ending September 2015, 16 company changes took place in the index due to acquisitions, market changes, transition to private equity, spinoffs, and the inability of companies to meet the index’s criteria. In addition, the S&P 500 is rebalanced quarterly to maintain its float-adjusted market capitalization.
To be included in the S&P 500, companies must be financially viable with positive as-reported earnings in the most recent quarter and the most recent four quarters (summed together). As a result of its market-capitalization weighting and construction methodology, the S&P 500 reflects the performance of the largest, most successful, publicly traded companies and industry sectors in the U.S.
Ironically, the S&P 500 index construction is based on precisely the characteristics that typical Modern Portfolio Theory proponents deride. The S&P 500 is something of a longer-term momentum investor, buying winners and selling losers, and leveraging up on top performers. There’s little hint of an efficient frontier in its composition and methodology.
Why not just buy and hold?
The S&P 500 was the basis of the first index fund with the launch of the Vanguard 500 Index Fund in 1976. The first commercially successful exchange traded fund was the SPDR S&P 500 ETF Trust (SPY), launched in 1994. These funds and others made it possible for individuals to invest in a fund designed to replicate the movement of the S&P 500. As an investment, however, the S&P 500 is neither the most reliable nor the easiest position to hold.
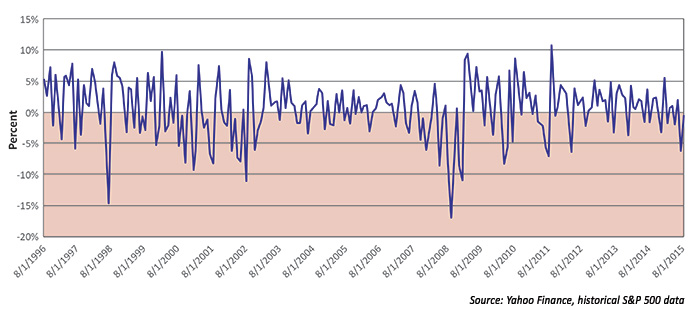
As the graphic below shows, the S&P 500 spends a considerable amount of time in negative territory, bringing all of the problems of behavioral finance into play. Periods of lower volatility tend to lull investors and provide a sense of security. Then comes the onset of high volatility when daily index moves have hit intraday extremes from a loss of 20.5% (10/19/87) to a gain of 11.6% (10/13/08). Daily news coverage of the index emphasizes its volatility. Speculation as to why the index has risen or fallen, and its short-term direction, adds to the stress of holding the index regardless of market conditions. Which is not to say the coverage isn’t often merited by the index: The steepest S&P 500 decline in its history was also the most recent bear market decline in 2008. This was enough to give most buy-and-hold investors ulcers with three one-day drops bordering on -9% and a fall over 50% at its depths.
20 YEARS OF S&P 500 MONTHLY RETURNS

The real issue is the behavioral response such a volatile investment vehicle can create for the individual investor. There has been exhaustive research showing that investors left to their own impulses and at the mercy of markets will most often make the wrong decisions at precisely the wrong time.
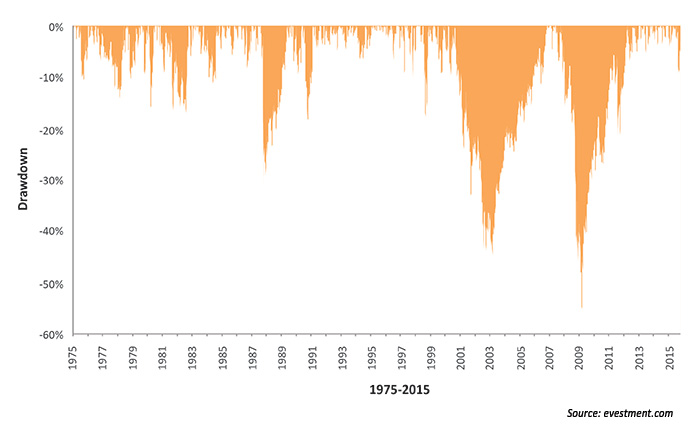
With respect to overall return, there have been extended periods in market history when holding the S&P 500 would have left investors with minimal, if any, gain on their investment for multi-year periods. The two longest “laydown” periods in recent market history were from 1973-82 and 2000-11. Investors would have achieved better returns by owning U.S. Treasury bills than the S&P 500 index during the 20+ years covered by those periods.
The S&P 500 tends to outperform indexes based on smaller-cap companies during periods of economic uncertainty when investors seek the safety of large, profitable companies. During periods of economic growth and innovation, size often works against the S&P 500 companies. Technology companies such as Apple, with a relatively small workforce and outsourced production, have shown greater agility, but doubling revenues will always be more difficult for a company with $182 billion in revenues versus $100 million. This is the reality that can make smaller-cap companies attractive in the right economic environment.
‘UNDERWATER’ DRAWDOWN PERIODS FOR THE S&P 500

But while the S&P 500 can be a challenging, roller-coaster, buy-and-hold investment for the long run, it can be a very effective trading tool thanks to index funds. In fact, the SPY is by far the largest ETF today by assets.
Among the active management advantages of the S&P 500 are its relatively long market history and availability of analytical data, clear inclusion parameters, and the liquidity provided by large trading volumes. An effective S&P 500 strategy doesn’t have to precisely call every market decline, as long as it mitigates the big declines and then returns relatively early to the market when the trend shifts again. These are the active management opportunities that can set up a portfolio for long-term outperformance.
Active management of S&P 500 index funds and ETFs can reduce the volatility inherent in the index and provide investors with the leverage to truly benefit from market recoveries. A buy-and-hold investment in the S&P 500 during the 2007-08 decline, for example, had to gain 100% just to get back to its pre-decline value. Avoiding those large losses provides the dual advantage of having both the portfolio capital resources and the risk appetite to take greater advantage of the market’s return to a bullish trend.
1. Apple Is 0.5% Of US GDP, 0.15% Of Global GDP, Tim Worstall, Forbes.com, Economics & Finance, Jan 30, 2015
2. Fervor for Large-Caps Drives Dow to New High, by Vito J. Racanelli, Barron’s, Sept. 20, 2014
 Linda Ferentchak is the president of Financial Communications Associates. Ms. Ferentchak has worked in financial industry communications since 1979 and has an extensive background in investment and money-management philosophies and strategies. She is a member of the Business Marketing Association and holds the APR accreditation from the Public Relations Society of America. Her work has received numerous awards, including the American Marketing Association’s Gold Peak award. activemanagersresource.com
