

Through May 18, the small-cap sector of U.S. equities had been on a tear, up nine out of 11 trading days and well ahead of the S&P 500 and Dow Jones Industrial Average (DJIA) in year-to-date performance.
In fact, the Russell 2000 broke out to new all-time highs that week, moving out of a trading range that had been in place since late January.
FIGURE 1: RUSSELL 2000 ONE-YEAR PRICE TREND
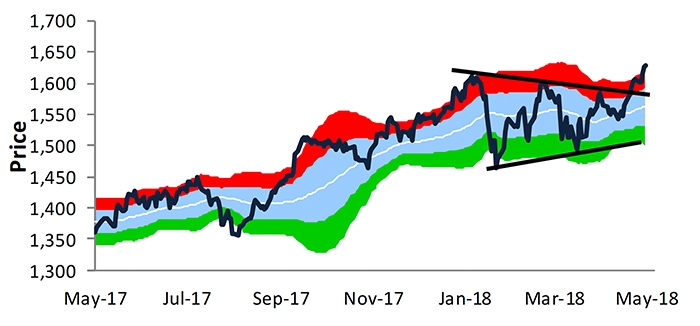
Source: Bespoke Investment Group, data through 5/18/18
As of last Friday, May 25, small-cap equities were still significantly outperforming the S&P 500 and the Dow, though trailing the NASDAQ 100.
TABLE 1: YEAR-TO-DATE PERFORMANCE OF MAJOR INDEX ETFS (%)

Source: Market data through 5/25/18
Bespoke Investment Group pointed out the week of May 14 that “the long-term chart for the Russell 2,000 looks just as impressive. … With a long uptrend channel in place and a breakout occurring this week, traders are now looking for another leg higher.”
FIGURE 2: RUSSELL 2000 OVER THE LAST THREE YEARS
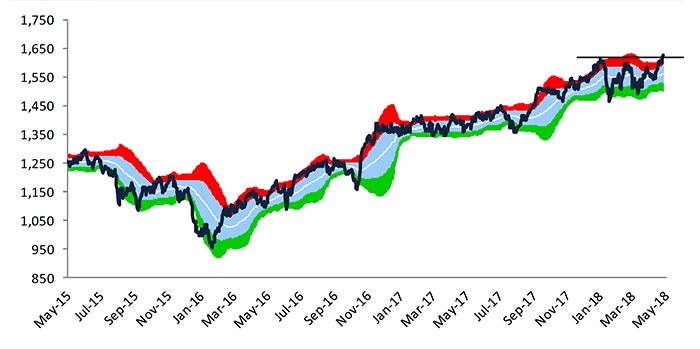
Source: Bespoke Investment Group, data through 5/18/18
What are some possible reasons for the small-cap outperformance?
MarketWatch recently cited several factors:
- “Heavier domestic revenue exposure, which insulates them (small caps) from headwinds such as rising bond yields, a stronger U.S. dollar, and trade tension.”
- Tax cuts and deregulation over the past year, which “should disproportionately benefit” the group.
- Small-cap stocks “are seen posting earnings growth of 46.3% over the coming quarter. That’s more than twice the 19.1% growth rate expected for components of the S&P 500.”
For current Q1 2018 results, Zack’s Research reported on May 18:
“88.5% of stocks in the small-cap S&P 600 index have come up with their earnings. Total earnings for these companies went up 21.4% on 9.7% higher revenues, with 60.5% beating EPS estimates and 72.2% beating revenue estimates.”
Bespoke Investment Group adds an optimistic note on the overall performance of small-cap stocks relative to the broader market:
“We’ve talked a lot over the years about the ‘leading’ nature of small caps. Small caps are generally thought to be a leading indicator for large caps. So, if small caps start to break down before large caps, it’s a bearish signal. And if small caps start to break out before large caps, it’s a bullish signal.”
However, columnist Mark Hulbert recently challenged this assertion at MarketWatch. Hulbert says, “The bulls need to remember that the Russell 2000 represents less than 10% of the total market cap of the entire U.S. stock market. That’s a small tail to wag a big dog.”
According to his analysis and that of Ned Davis Research, small-cap stocks hit their peak after the broader market more than 50% of the time in 29 bull-market tops since 1926.