

January has seen the threat of armed conflict in the Middle East, potential oil market disruptions, an ongoing presidential impeachment process, an aging bull market, and assorted other risk factors, and yet the U.S. equity market has taken all of this in stride—at least through the first half of the month.
Market strategist and technical analyst Rob Hanna of Quantifiable Edges wrote on Jan. 16,
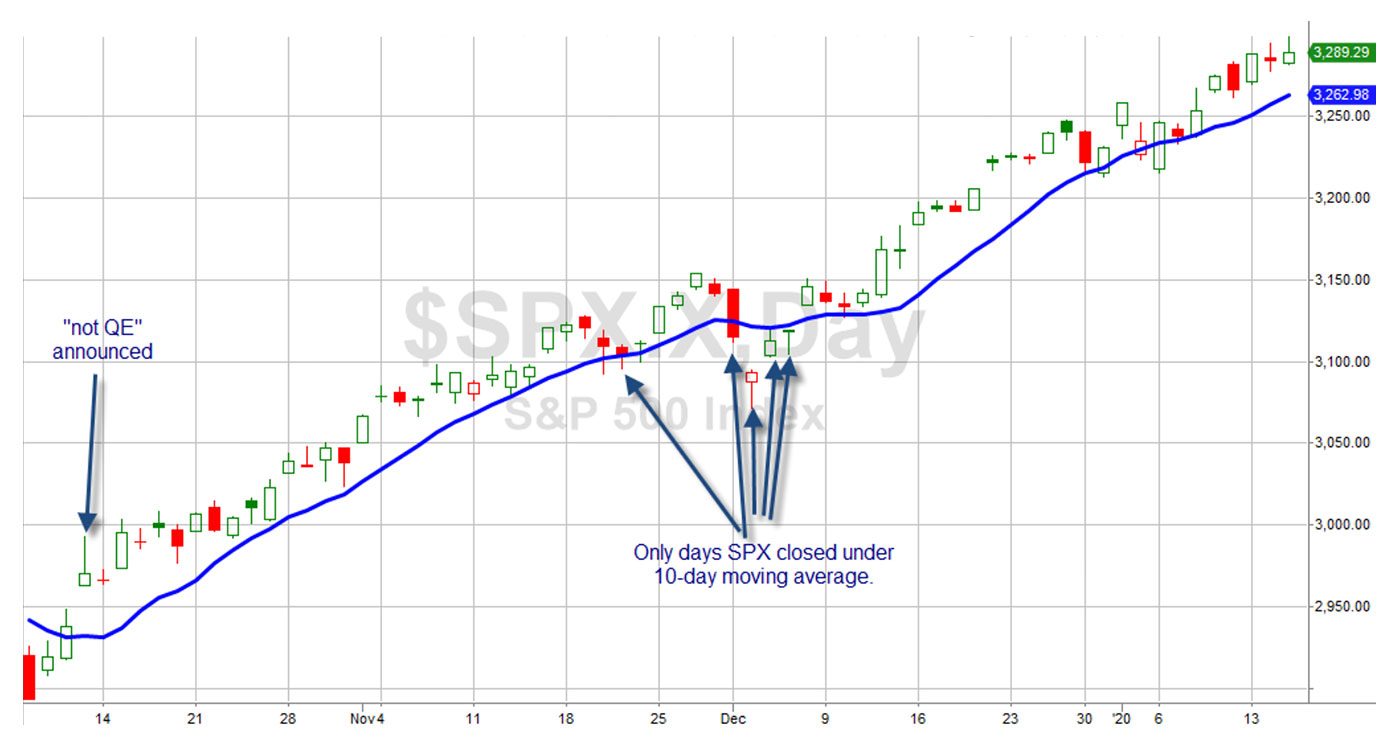
Source: Quantifiable Edges, TradeStation
Mr. Hanna continues,
“I have noted a few times lately that the market has gone an extended period without any closes below the 10ma. But what is more remarkable is how few days it has closed below the 10ma since ‘not QE’ was announced on October 11th.
“In the last 67 trading days, there have only been 5 closes below the 10ma for SPX. There has not been a 67-day period with only 5 closes below the 10ma since 1972. And looking back to 1928 (when the S&P 500 was the S&P 90), there have only been 6 other instances: September 1929, July 1933, March 1943, June 1957, November 1965, and late February / early March of 1972. In other words, the persistency of this rally is extremely rare, and over the last 48 years, it is unheard of.”
Bespoke Investment Group commented this past weekend on how most analyst forecasts for 2020 in December look quite conservative given January’s market rally:
“We’re just twelve days into the new year, but already it’s a year that is topping some strategists’ year end targets. Granted, strategists were extremely conservative heading into the year, but if you’re a Wall Street strategist and already you’re going back to the drawing board just twelve days into the year, it’s going to be a long year.”
“As of this week, the average analyst target price for stocks in the S&P 500 is just 4.64% above the average actual share price. Going back to at least 2004, there has never been another time where stock prices have been so close to their average analyst price targets. As an analyst, it’s hard to justify a buy rating on a stock if it’s trading at your price target!”
The S&P 500 (SPX) closed on Friday, Jan. 17, at 3,329.6. This represented a 3% gain year to date, an 11% gain over the last three months, and a 28% gain for the past 12 months.
Here is a look at some of the forecasts for the S&P 500 by major Wall Street firms and strategists from December 2019 as compiled by Barron’s. Barron’s notes that the average call for the 10 analysts they surveyed was for an increase of 4% for the S&P 500 in 2020, saying, “Layer on a roughly 2% dividend yield, and stocks could deliver a total return of about 6% next year.”
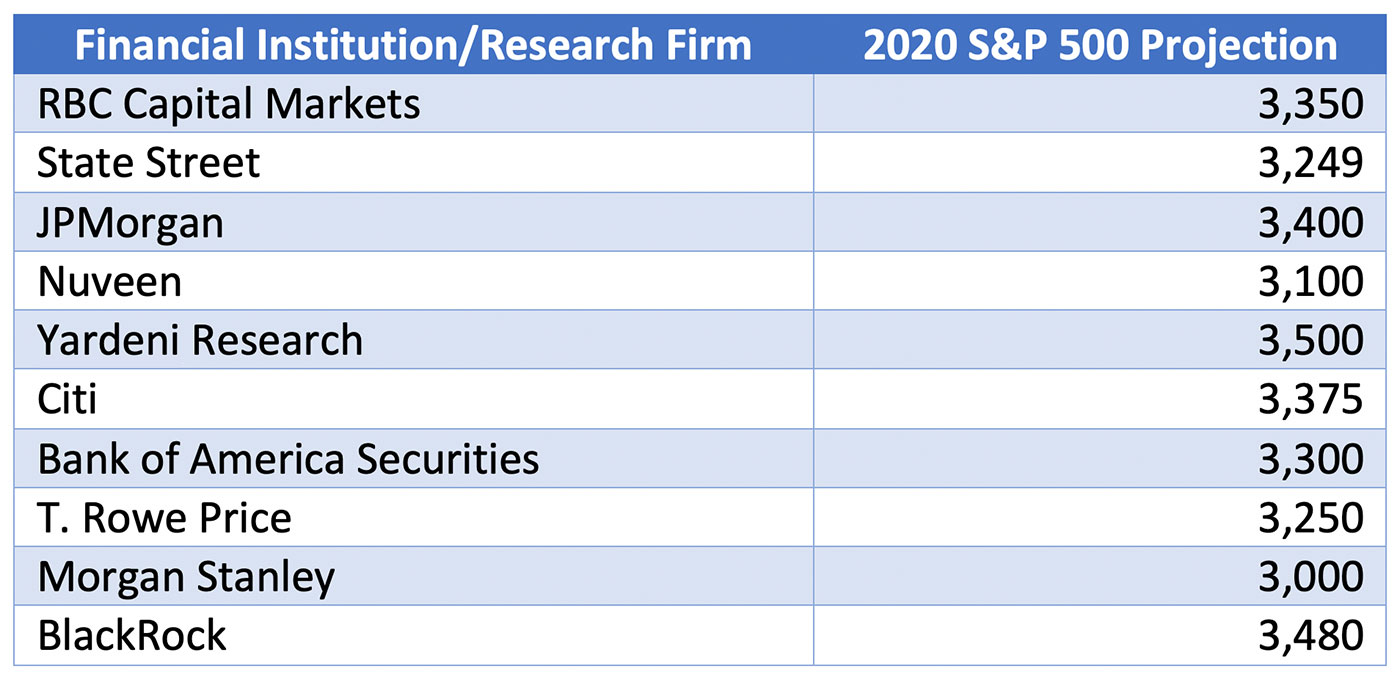
Source: Barron’s
Interestingly, one of the analysts with a conservative 2020 target that has already been exceeded in January noted in the survey last December, “The liquidity picture is quite robust and will stay that way for at least the first quarter of the year. There is little risk of a recession near-term and people are feeling a bit more optimistic, so we could see valuations overshoot to the upside in the next three or four months.”
On a somewhat related note, several market columnists have noted that the “magazine cover jinx” has just triggered. You can read more about that here, but essentially this says that when the cover of a major national financial media publication features the market’s next big target, it is time to be cautious. In this case, Barron’s recent cover touted, “Dow 30,000.” (The linked article notes this target is not very far-fetched at current levels!)
Taking a more analytical perspective, Bespoke Investment Group looked at how markets have historically fared after having a very strong open to January:
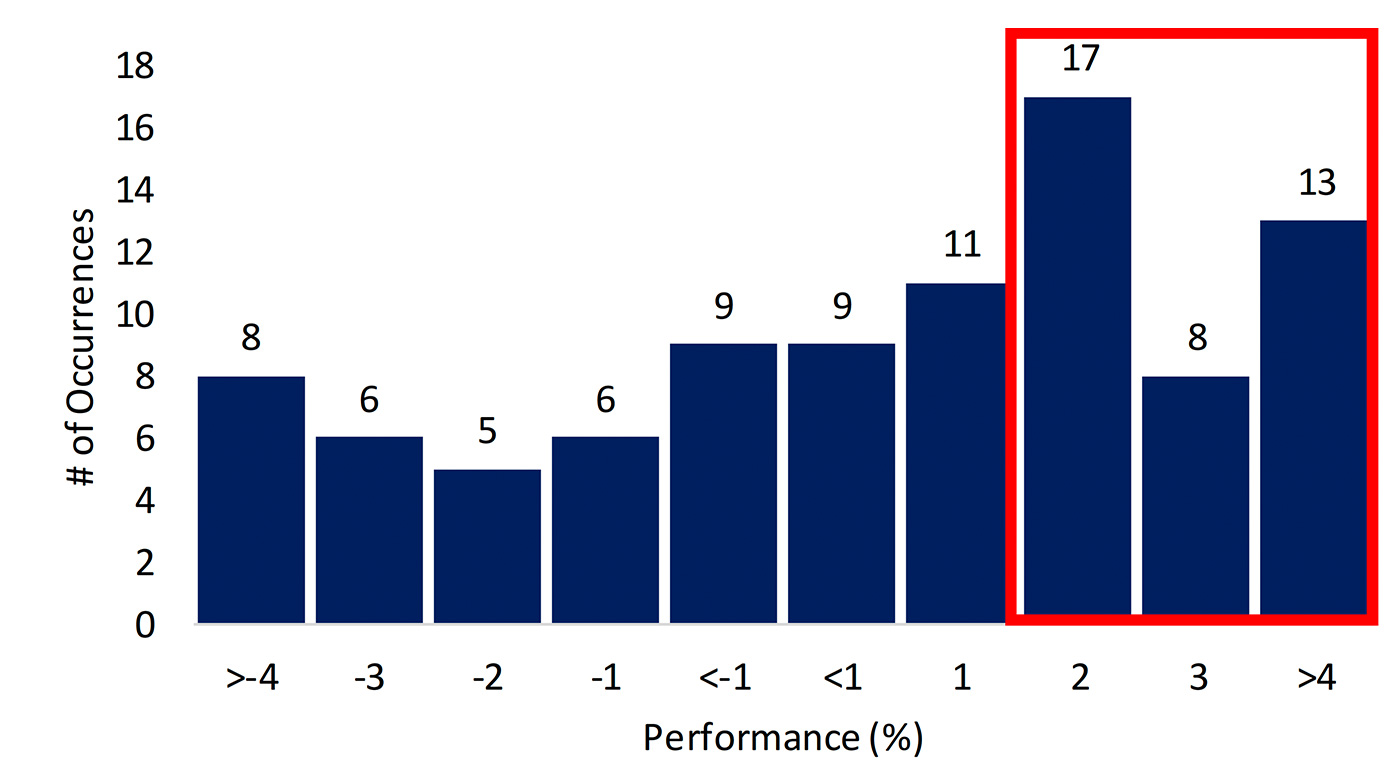
Source: Bespoke Investment Group, data through 1/17/20
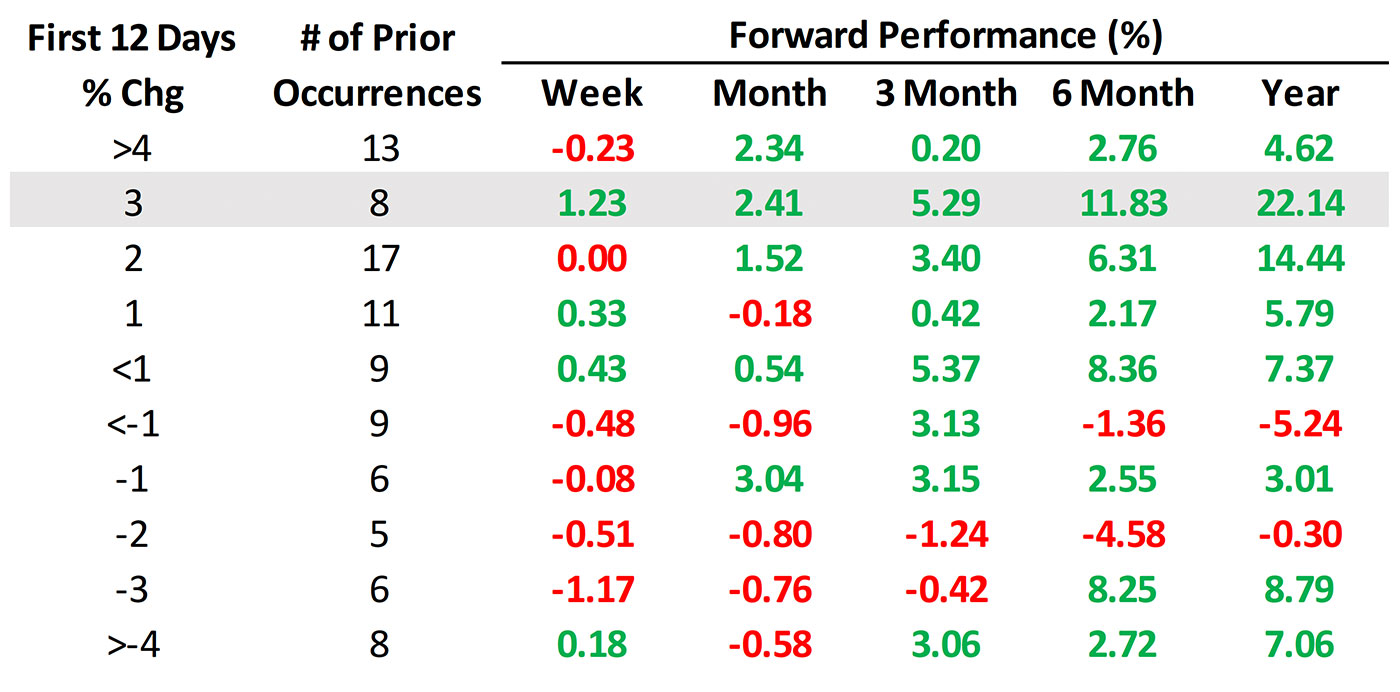
Source: Bespoke Investment Group, data through 1/17/20